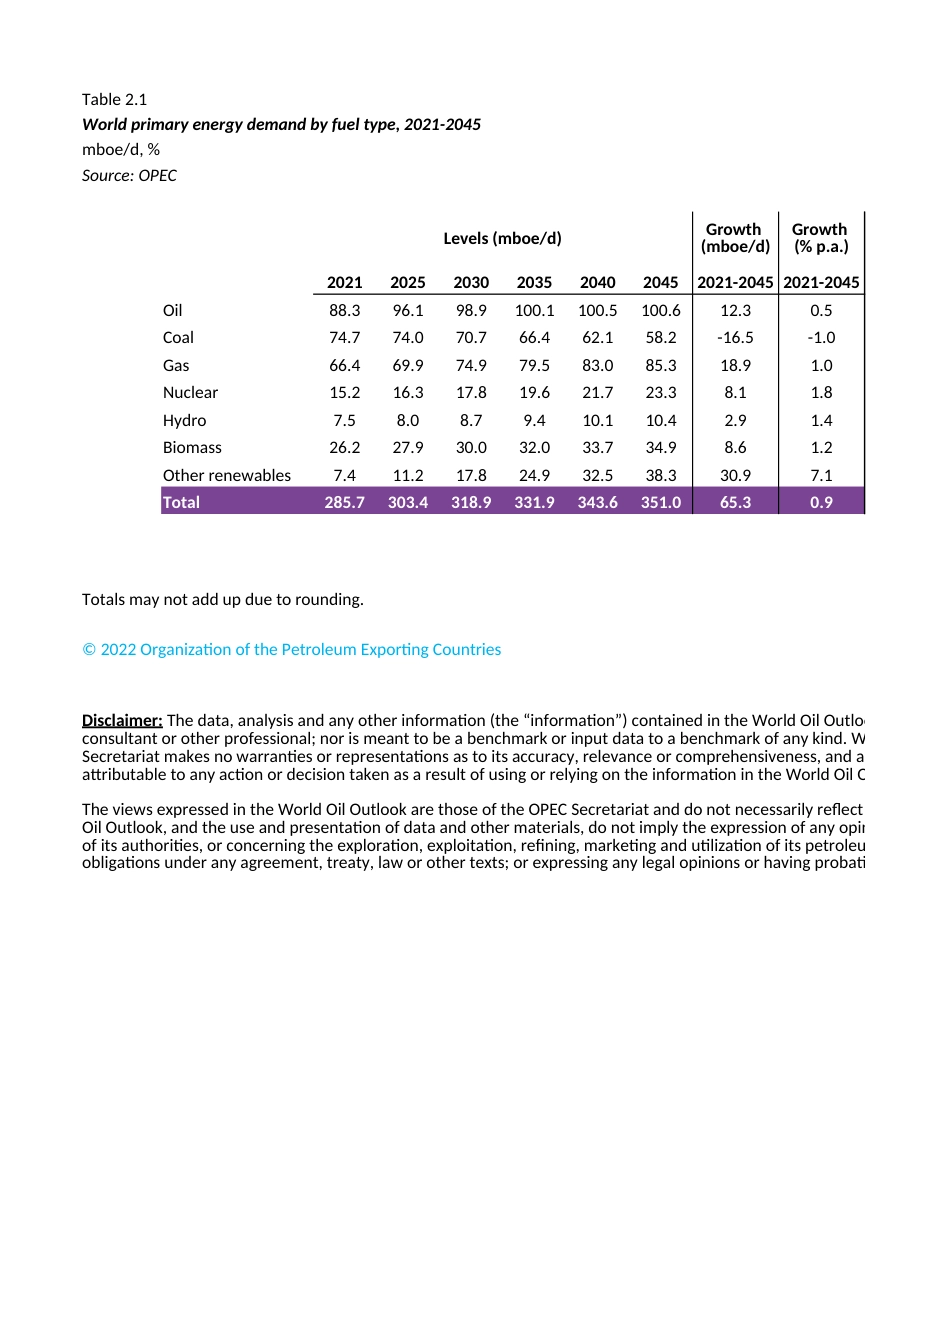
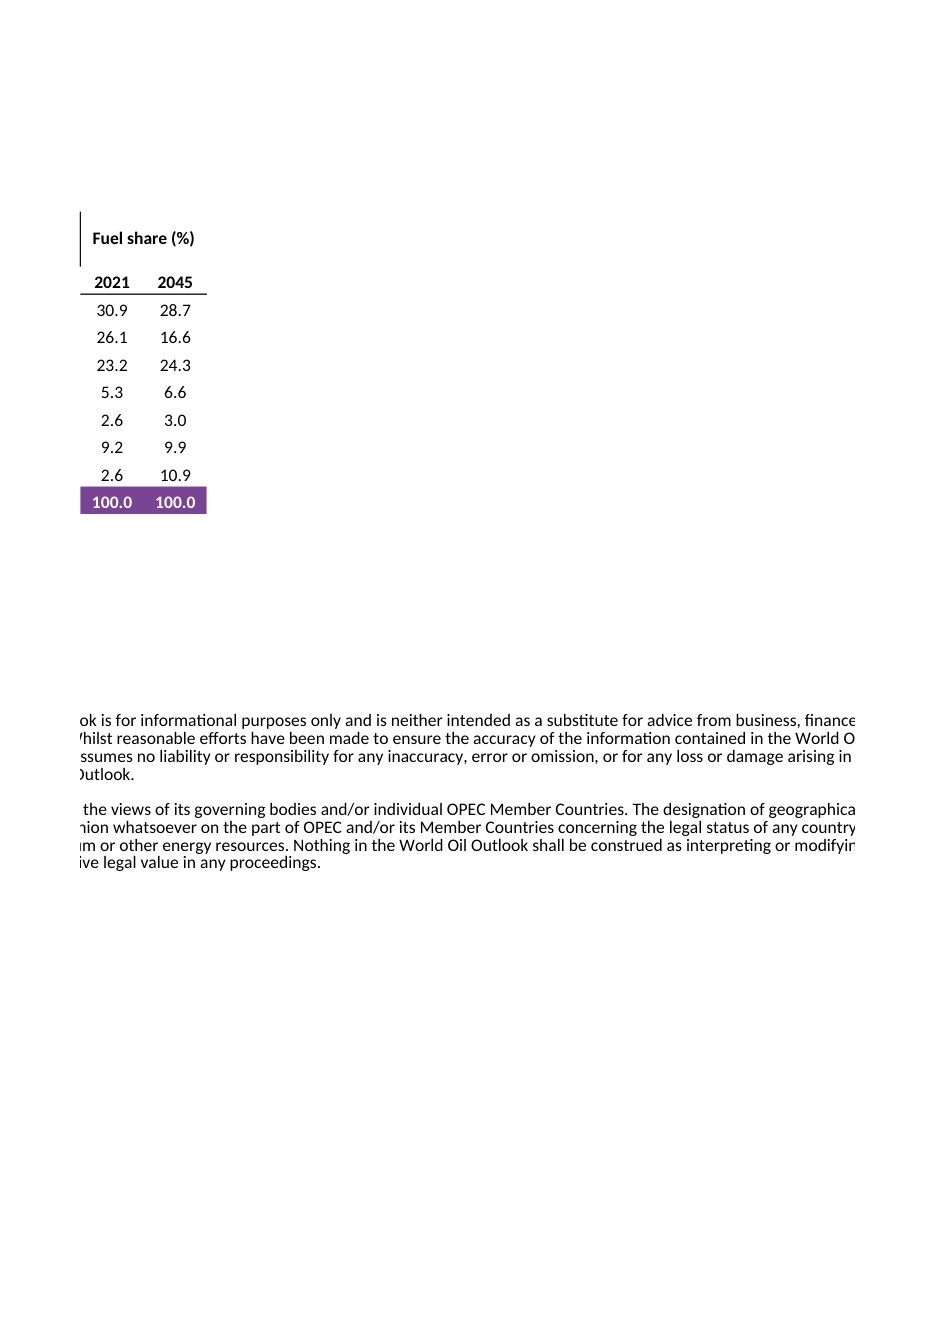
Table 2.1World primary energy demand by fuel type, 2021-2045mboe/d, %Source: OPECLevels (mboe/d)2021202520302035204020452021-2045 2021-2045Oil88.396.198.9100.1100.5100.612.30.5Coal74.774.070.766.462.158.2-16.5-1.0Gas66.469.974.979.583.085.318.91.0Nuclear15.216.317.819.621.723.38.11.8Hydro 7.58.08.79.410.110.42.91.4Biomass26.227.930.032.033.734.98.61.2Other renewables7.411.217.824.932.538.330.97.1Total285.7303.4318.9331.9343.6351.065.30.9Totals may not add up due to rounding.© 2022 Organization of the Petroleum Exporting CountriesGrowth (mboe/d)Growth (% p.a.)Disclaimer: The data, analysis and any other information (the “information”) contained in the World Oil Outlook is for infoconsultant or other professional; nor is meant to be a benchmark or input data to a benchmark of any kind. Whilst reasonSecretariat makes no warranties or representations as to its accuracy, relevance or comprehensiveness, and assumes no liattributable to any action or decision taken as a result of using or relying on the information in the World Oil Outlook. The views expressed in the World Oil Outlook are those of the OPEC Secretariat and do not necessarily reflect the views ofOil Outlook, and the use and presentation of data and other materials, do not imply the expression of any opinion whatsoof its authorities, or concerning the exploration, exploitation, refining, marketing and utilization of its petroleum or other eobligations under any agreement, treaty, law or other texts; or expressing any legal opinions or having probative legal valuFuel share (%)2021204530.928.726.116.623.224.35.36.62.63.09.29.92.610.9100.0100.0ld Oil Outlook is for informational purposes only and is neither intended as a substitute for advice from business, finance, investment any kind. Whilst reason...