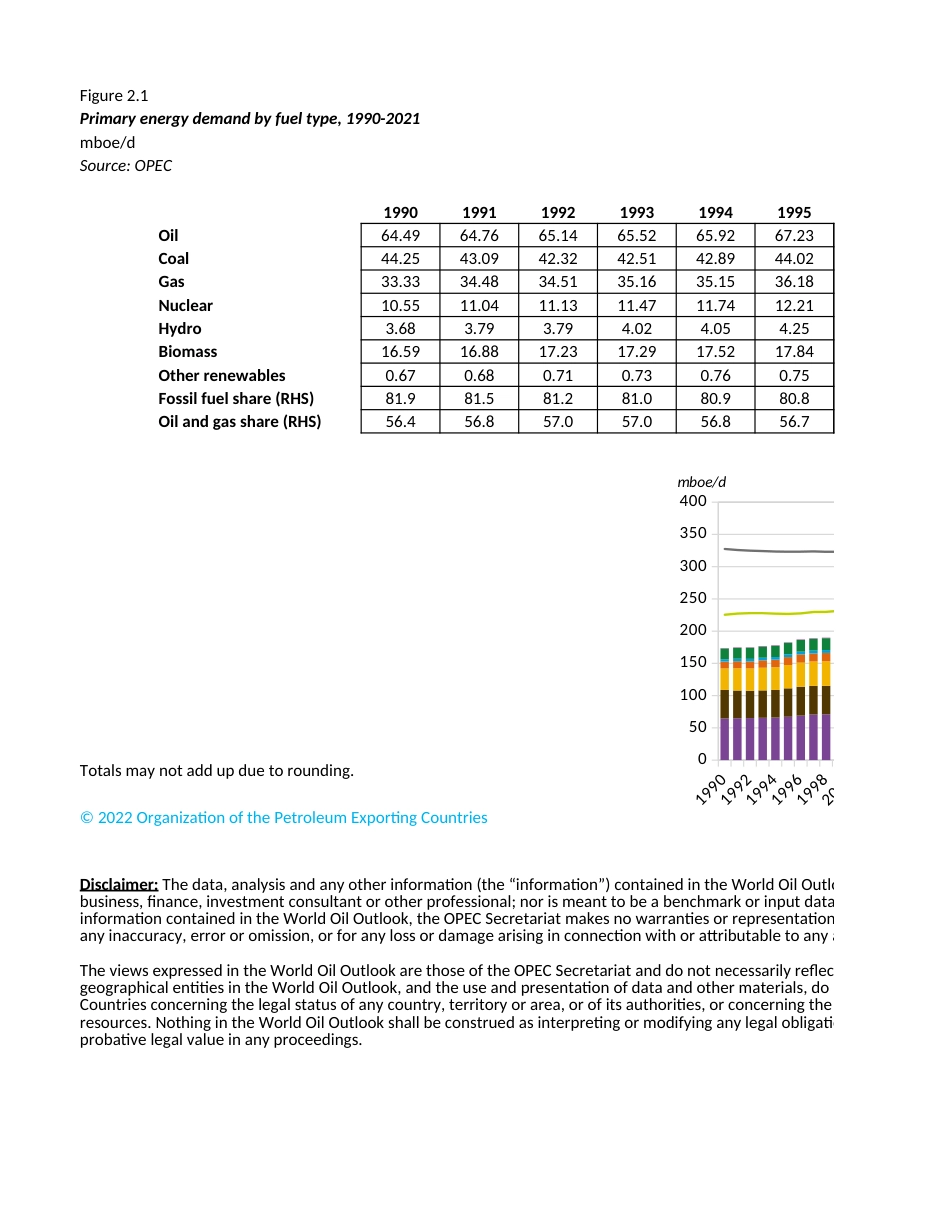
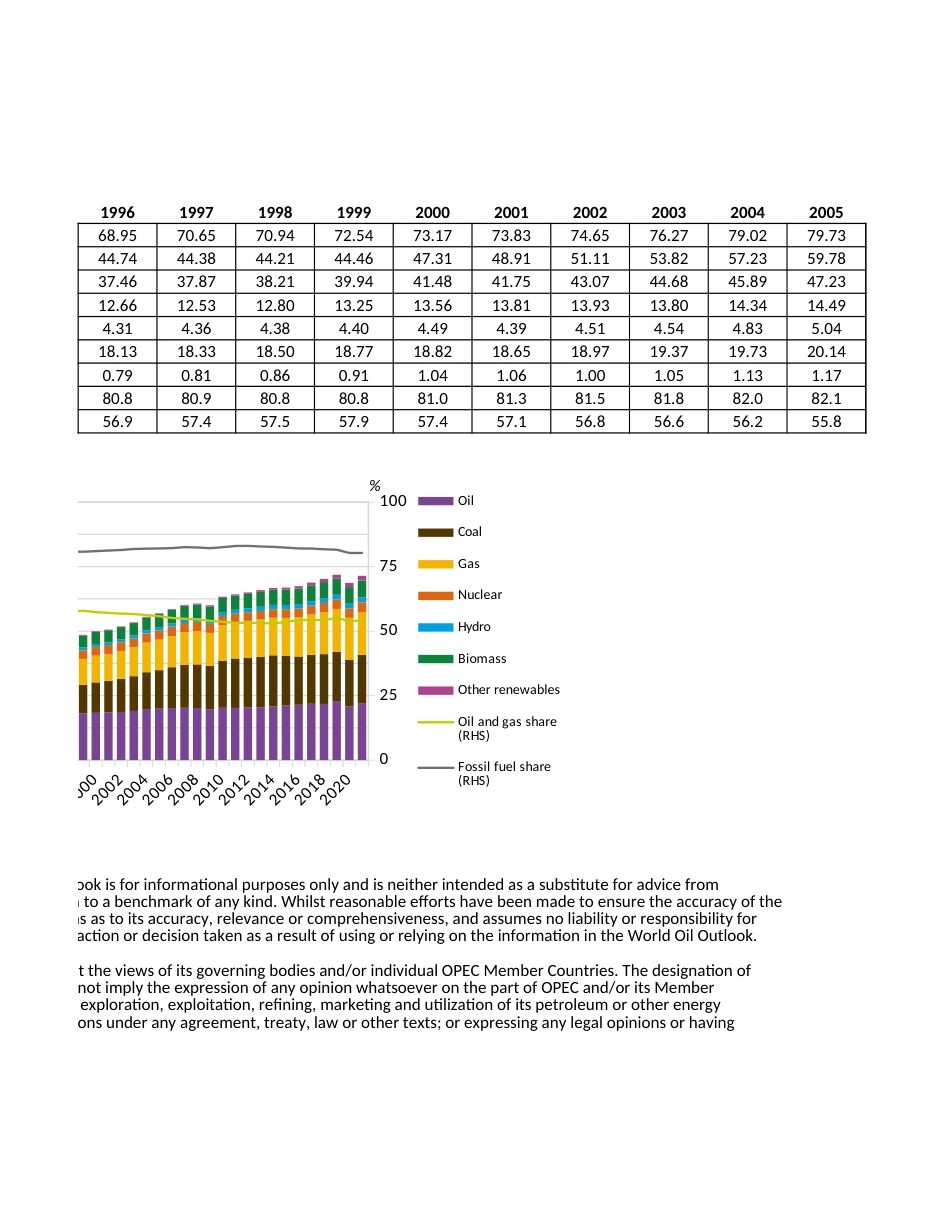
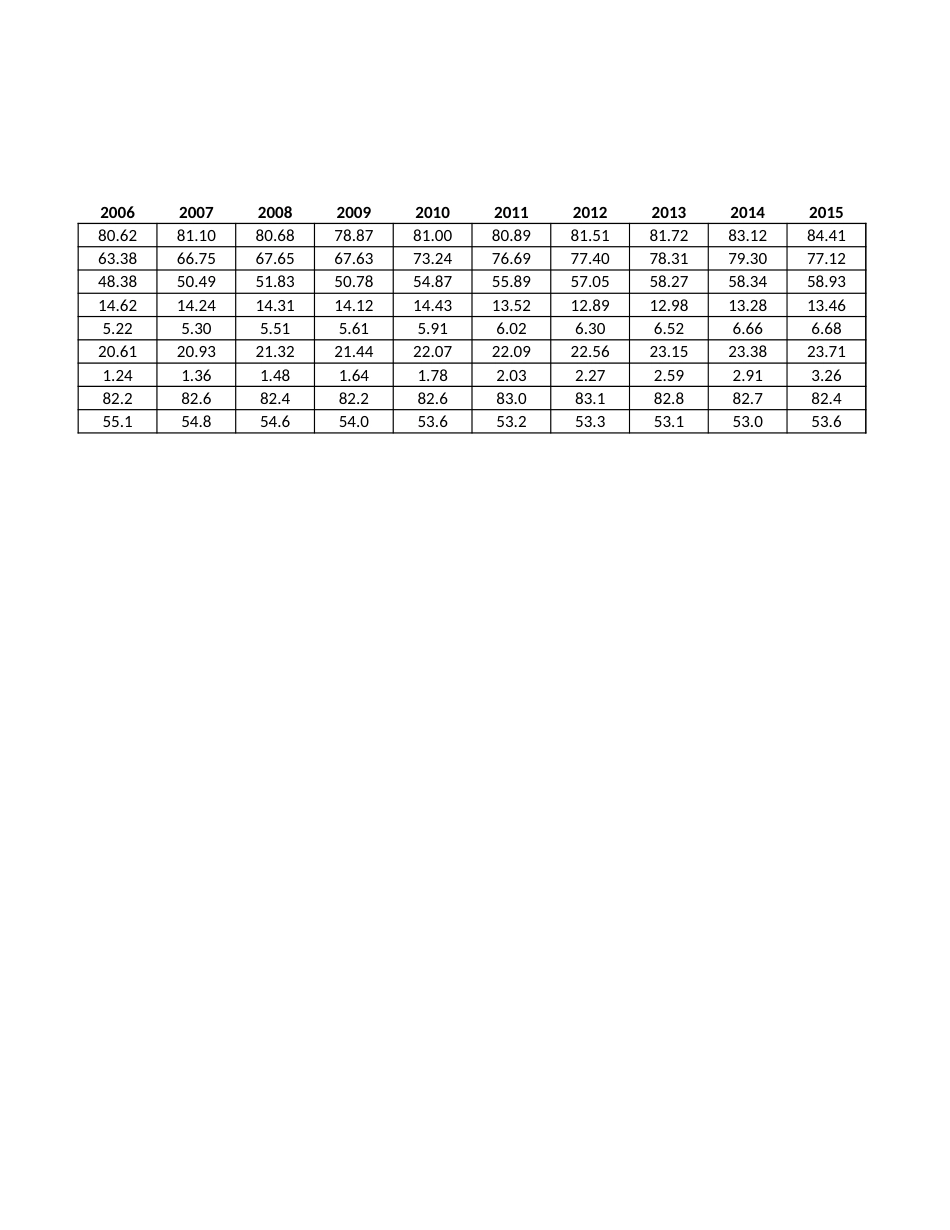
Figure 2.1Primary energy demand by fuel type, 1990-2021mboe/dSource: OPEC199019911992199319941995Oil64.4964.7665.1465.5265.9267.23Coal44.2543.0942.3242.5142.8944.02Gas33.3334.4834.5135.1635.1536.18Nuclear10.5511.0411.1311.4711.7412.21Hydro 3.683.793.794.024.054.25Biomass16.5916.8817.2317.2917.5217.84Other renewables0.670.680.710.730.760.75Fossil fuel share (RHS)81.981.581.281.080.980.8Oil and gas share (RHS)56.456.857.057.056.856.7Totals may not add up due to rounding.© 2022 Organization of the Petroleum Exporting CountriesDisclaimer: The data, analysis and any other information (the “information”) contained in the World Oil Outlook is for informabusiness, finance, investment consultant or other professional; nor is meant to be a benchmark or input data to a benchmark information contained in the World Oil Outlook, the OPEC Secretariat makes no warranties or representations as to its accuracany inaccuracy, error or omission, or for any loss or damage arising in connection with or attributable to any action or decisionThe views expressed in the World Oil Outlook are those of the OPEC Secretariat and do not necessarily reflect the views of its geographical entities in the World Oil Outlook, and the use and presentation of data and other materials, do not imply the expCountries concerning the legal status of any country, territory or area, or of its authorities, or concerning the exploration, explresources. Nothing in the World Oil Outlook shall be construed as interpreting or modifying any legal obligations under any agprobative legal value in any proceedings.19901992199419961998200020022004200620082050100150200250300350400mboe/d199619971998199920002001200220032004200568.9570.6570.9472.5473.1773.8374.6576.2779.0279.7344.7444.3844.2144.4647.3148.9151.1153.8257.2359.7837.4...