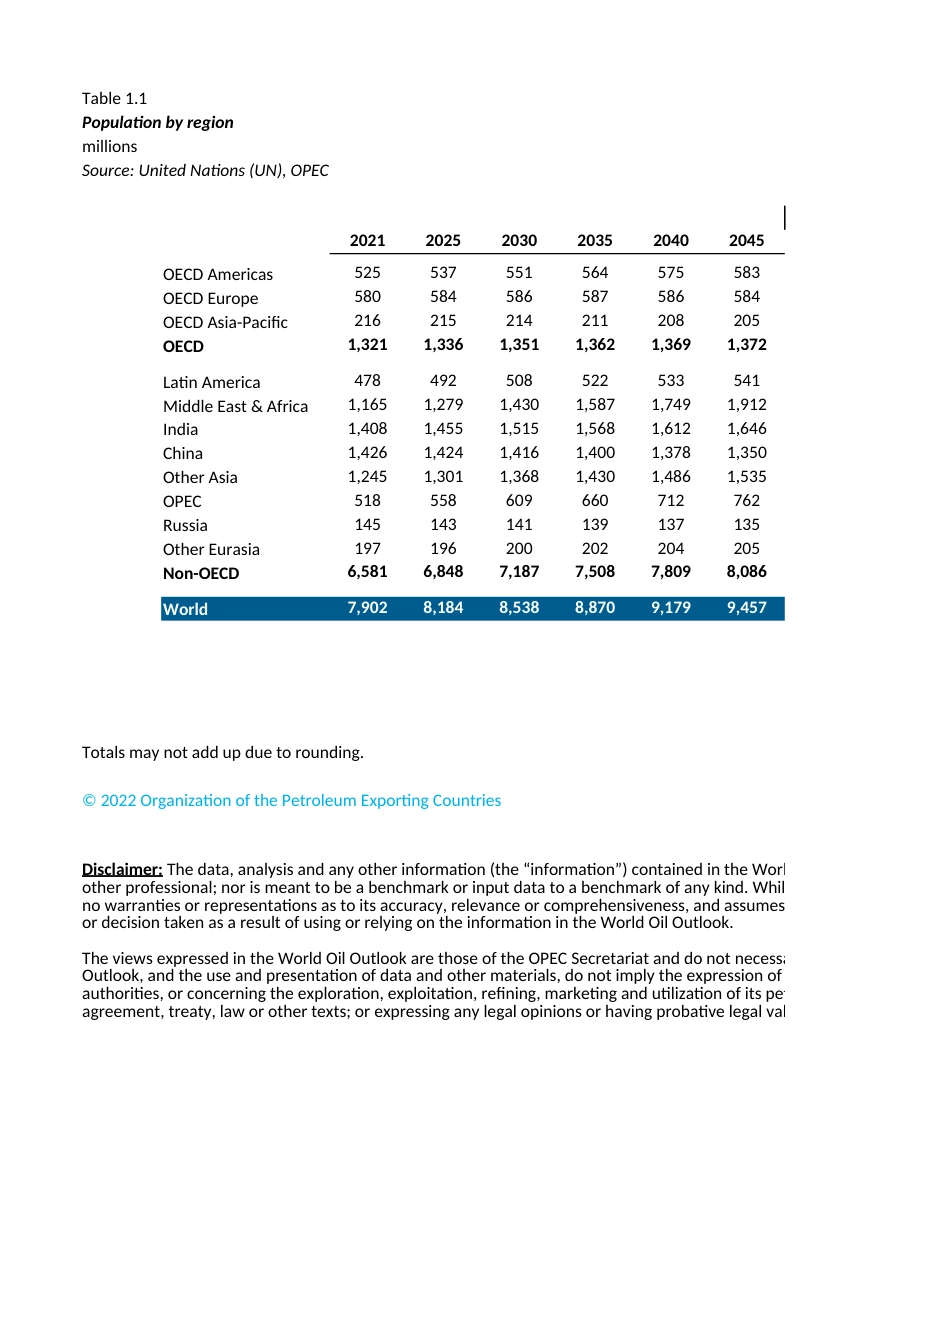
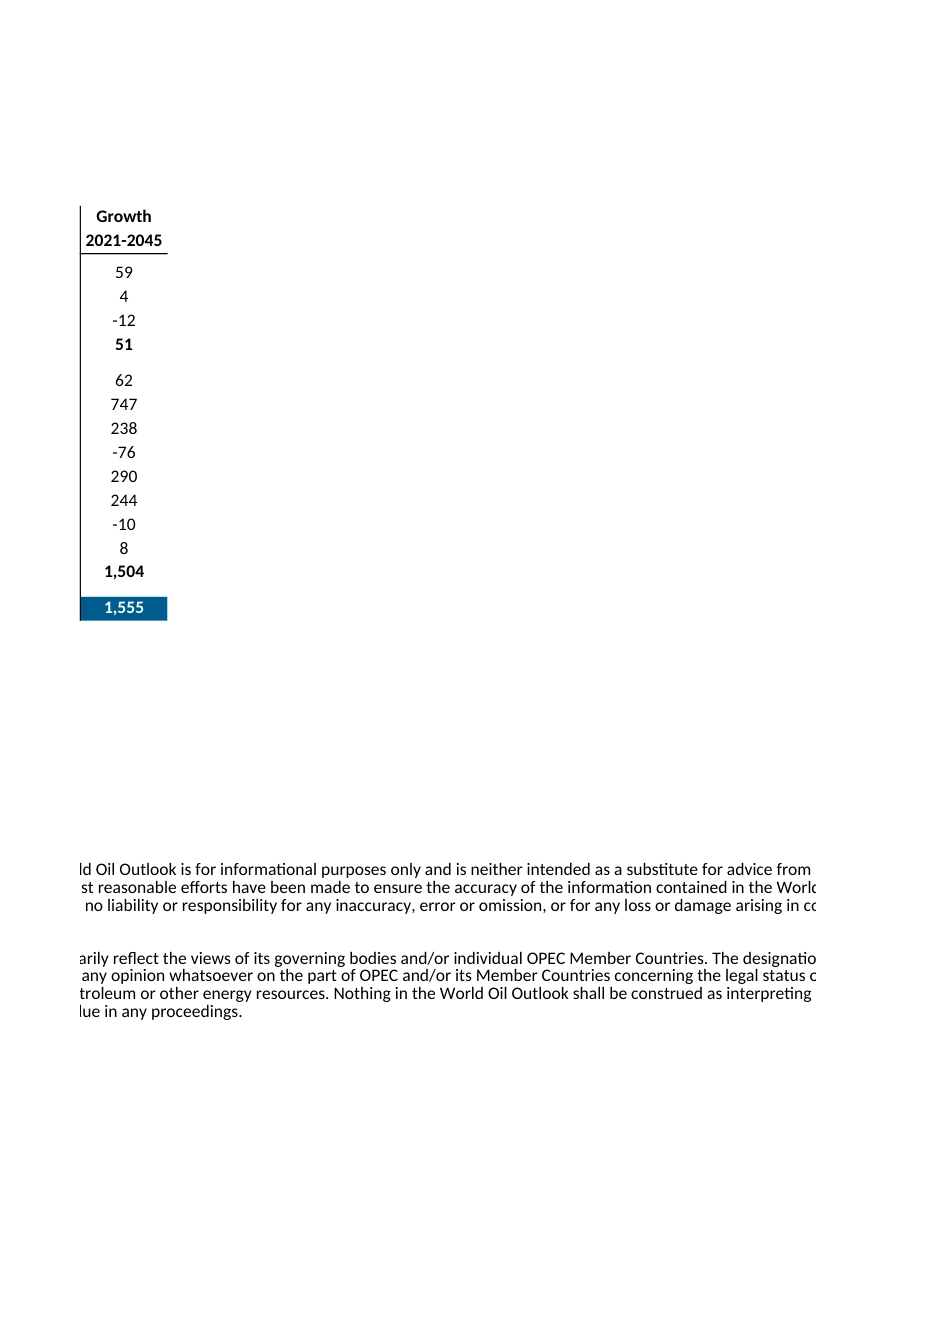
Table 1.1Population by regionmillionsSource: United Nations (UN), OPEC202120252030203520402045OECD Americas525537551564575583OECD Europe580584586587586584OECD Asia-Pacific216215214211208205OECD1,3211,3361,3511,3621,3691,372Latin America478492508522533541Middle East & Africa1,1651,2791,4301,5871,7491,912India1,4081,4551,5151,5681,6121,646China1,4261,4241,4161,4001,3781,350Other Asia1,2451,3011,3681,4301,4861,535OPEC518558609660712762Russia145143141139137135Other Eurasia197196200202204205Non-OECD6,5816,8487,1877,5087,8098,086World7,9028,1848,5388,8709,1799,457Totals may not add up due to rounding.© 2022 Organization of the Petroleum Exporting CountriesDisclaimer: The data, analysis and any other information (the “information”) contained in the World Oil Outlook is for infoother professional; nor is meant to be a benchmark or input data to a benchmark of any kind. Whilst reasonable efforts hano warranties or representations as to its accuracy, relevance or comprehensiveness, and assumes no liability or responsibor decision taken as a result of using or relying on the information in the World Oil Outlook. The views expressed in the World Oil Outlook are those of the OPEC Secretariat and do not necessarily reflect the views ofOutlook, and the use and presentation of data and other materials, do not imply the expression of any opinion whatsoeveauthorities, or concerning the exploration, exploitation, refining, marketing and utilization of its petroleum or other energyagreement, treaty, law or other texts; or expressing any legal opinions or having probative legal value in any proceedings.Growth2021-2045594-125162747238-76290244-1081,5041,555in the World Oil Outlook is for informational purposes only and is neither intended as a substitute for advice from business, finance,...