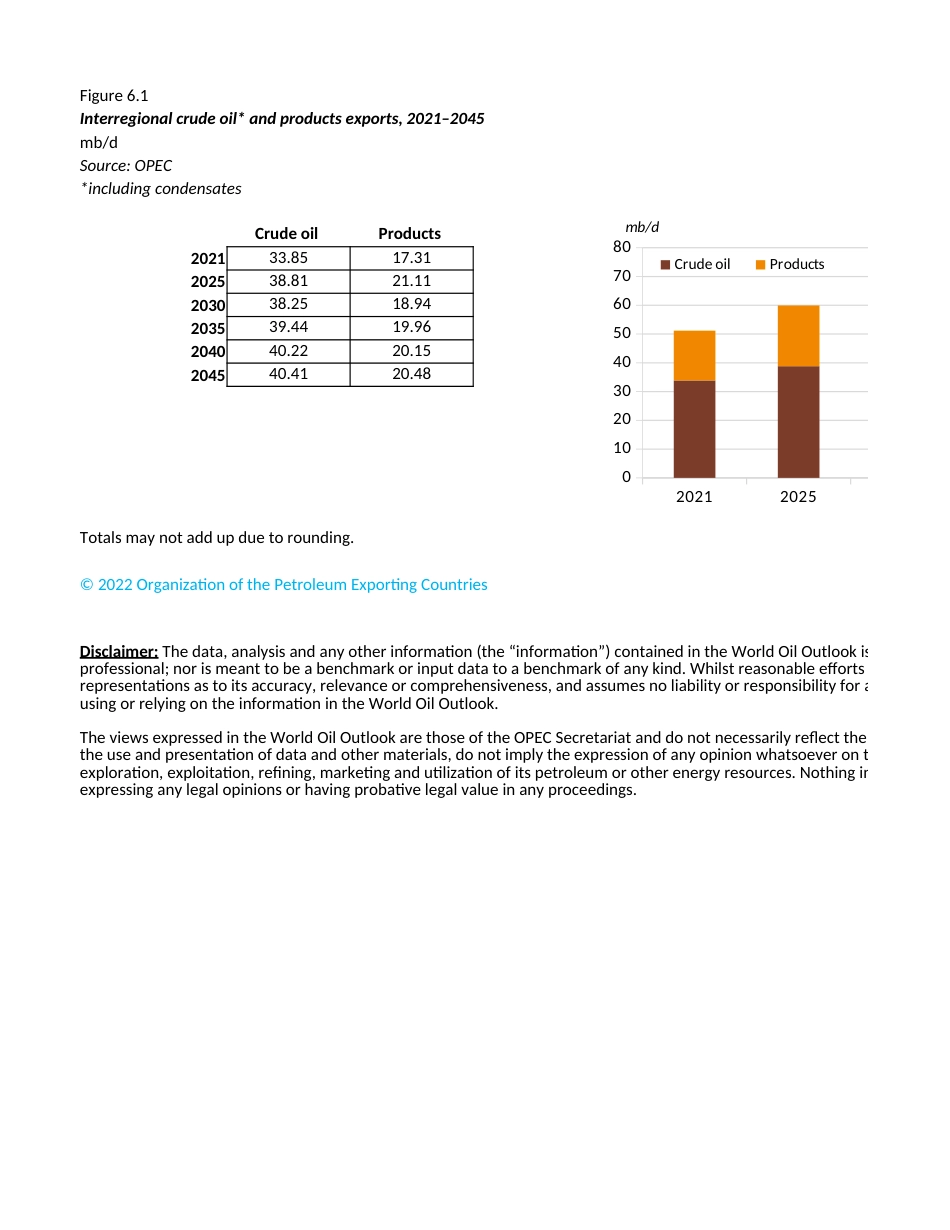
Figure 6.1Interregional crude oil* and products exports, 2021–2045mb/dSource: OPEC*including condensatesCrude oil Products 202133.8517.31202538.8121.11203038.2518.94203539.4419.96204040.2220.15204540.4120.48Totals may not add up due to rounding.© 2022 Organization of the Petroleum Exporting CountriesDisclaimer: The data, analysis and any other information (the “information”) contained in the World Oil Outlook is for informaprofessional; nor is meant to be a benchmark or input data to a benchmark of any kind. Whilst reasonable efforts have been mrepresentations as to its accuracy, relevance or comprehensiveness, and assumes no liability or responsibility for any inaccurausing or relying on the information in the World Oil Outlook. The views expressed in the World Oil Outlook are those of the OPEC Secretariat and do not necessarily reflect the views of its the use and presentation of data and other materials, do not imply the expression of any opinion whatsoever on the part of Oexploration, exploitation, refining, marketing and utilization of its petroleum or other energy resources. Nothing in the World expressing any legal opinions or having probative legal value in any proceedings.20212025203001020304050607080Crude oil Products mb/dOil Outlook is for informational purposes only and is neither intended as a substitute for advice from business, finance, investment consultaable efforts have been made to ensure the accuracy of the information contained in the World Oil Outlook, the OPEC Secretariat makes nonsibility for any inaccuracy, error or omission, or for any loss or damage arising in connection with or attributable to any action or decisiony reflect the views of its governing bodies and/or individual OPEC Member Co...