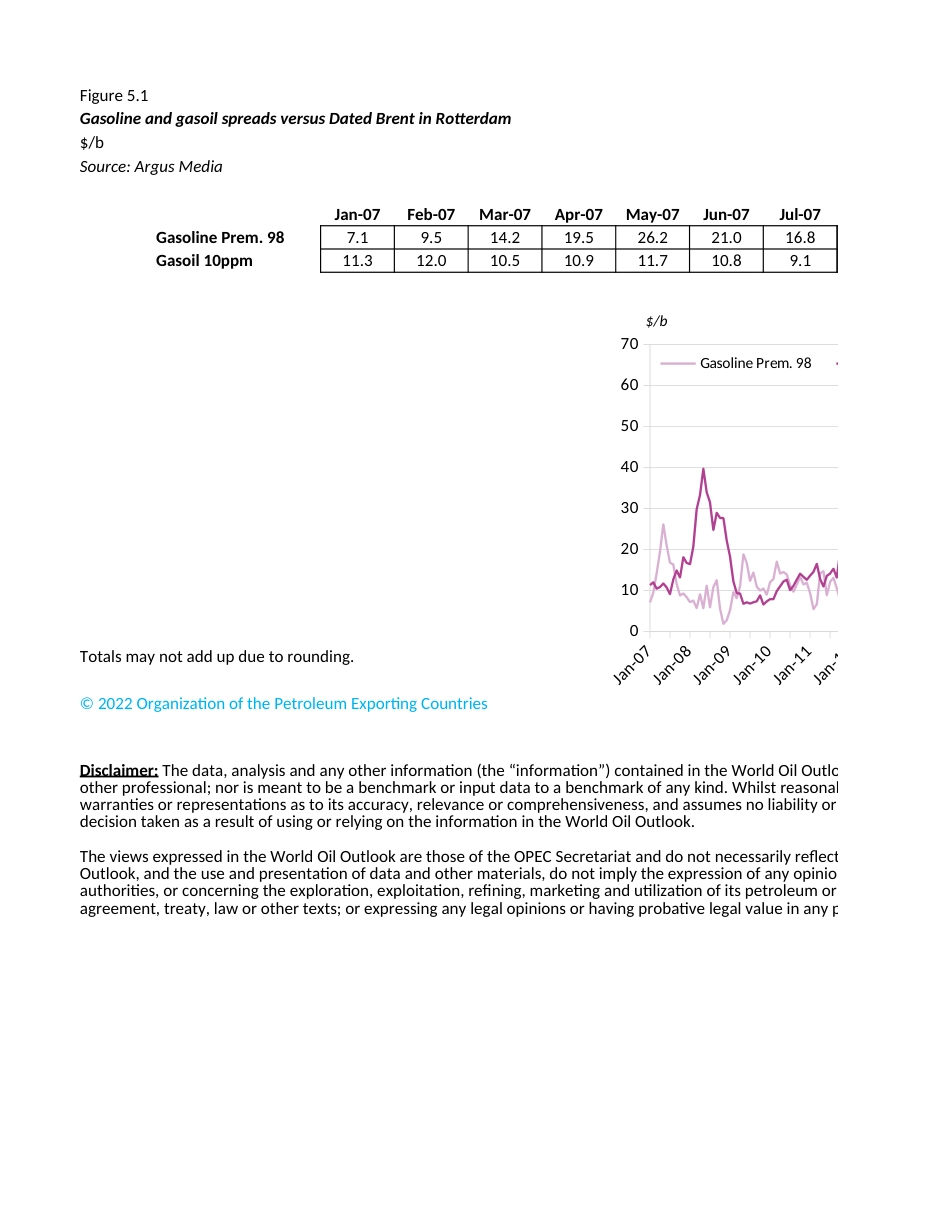
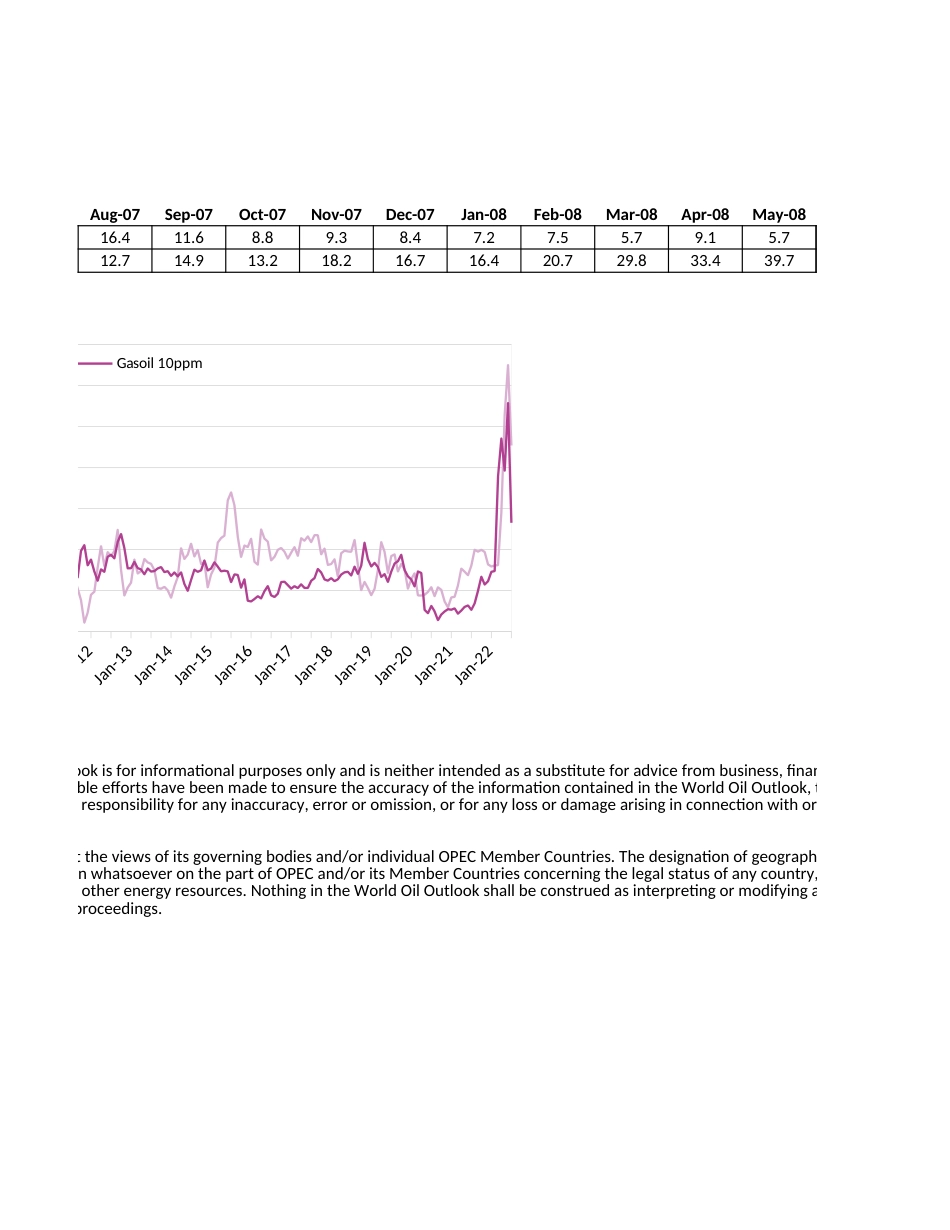
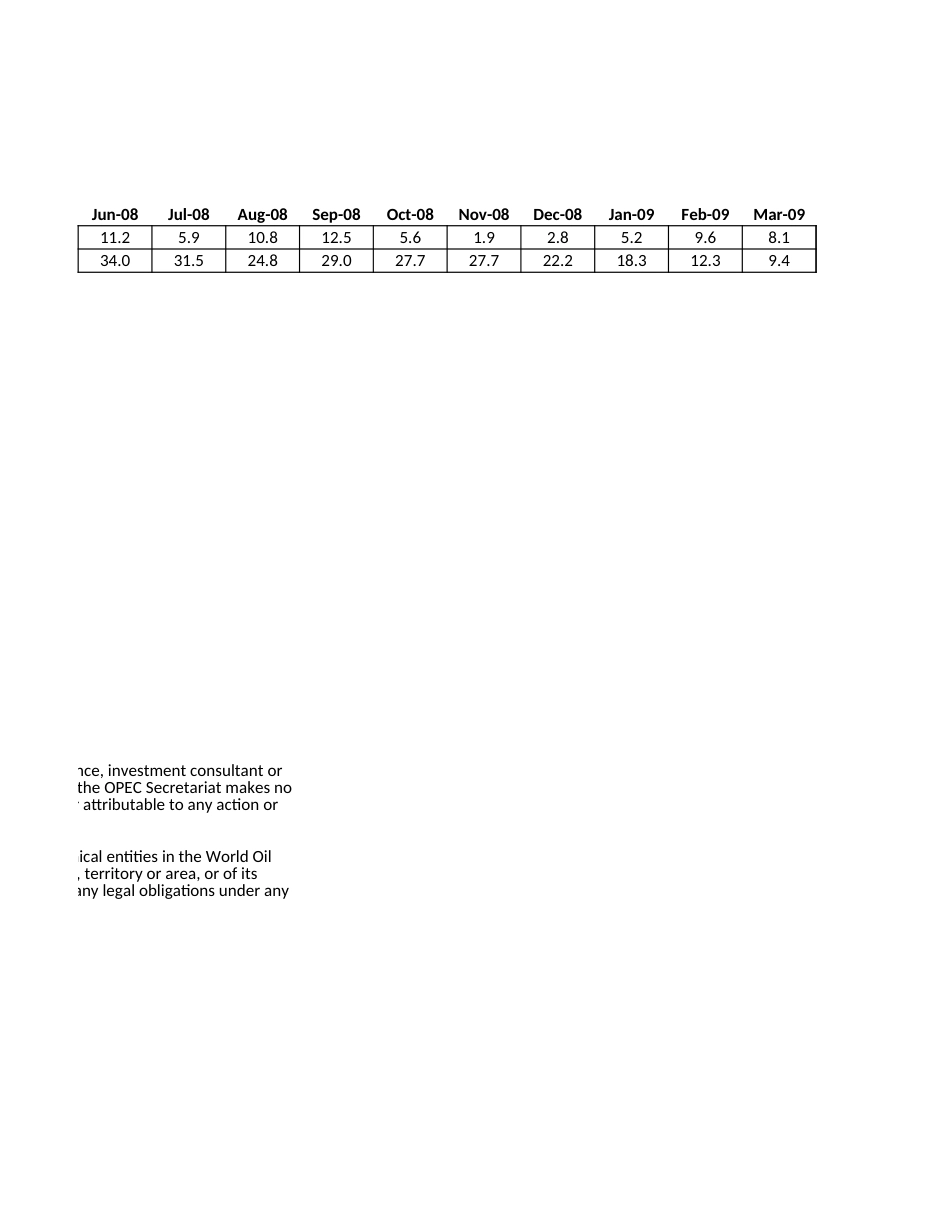
Figure 5.1Gasoline and gasoil spreads versus Dated Brent in Rotterdam$/bSource: Argus MediaJan-07Feb-07Mar-07Apr-07May-07Jun-07Jul-07Gasoline Prem. 987.19.514.219.526.221.016.8Gasoil 10ppm11.312.010.510.911.710.89.1Totals may not add up due to rounding.© 2022 Organization of the Petroleum Exporting CountriesDisclaimer: The data, analysis and any other information (the “information”) contained in the World Oil Outlook is for informaother professional; nor is meant to be a benchmark or input data to a benchmark of any kind. Whilst reasonable efforts have bwarranties or representations as to its accuracy, relevance or comprehensiveness, and assumes no liability or responsibility fodecision taken as a result of using or relying on the information in the World Oil Outlook. The views expressed in the World Oil Outlook are those of the OPEC Secretariat and do not necessarily reflect the views of its Outlook, and the use and presentation of data and other materials, do not imply the expression of any opinion whatsoever onauthorities, or concerning the exploration, exploitation, refining, marketing and utilization of its petroleum or other energy resagreement, treaty, law or other texts; or expressing any legal opinions or having probative legal value in any proceedings.Jan-07Jan-08Jan-09Jan-10Jan-11Jan-12Jan-13Jan-14Jan010203040506070Gasoline Prem. 98Gasoil 10pp$/bAug-07Sep-07Oct-07Nov-07Dec-07Jan-08Feb-08Mar-08Apr-08May-0816.411.68.89.38.47.27.55.79.15.712.714.913.218.216.716.420.729.833.439.7rld Oil Outlook is for informational purposes only and is neither intended as a substitute for advice from business, finance, investment conilst reasonable efforts have been made to ensure the accuracy of the information contained in the World Oil Outlook, the ...