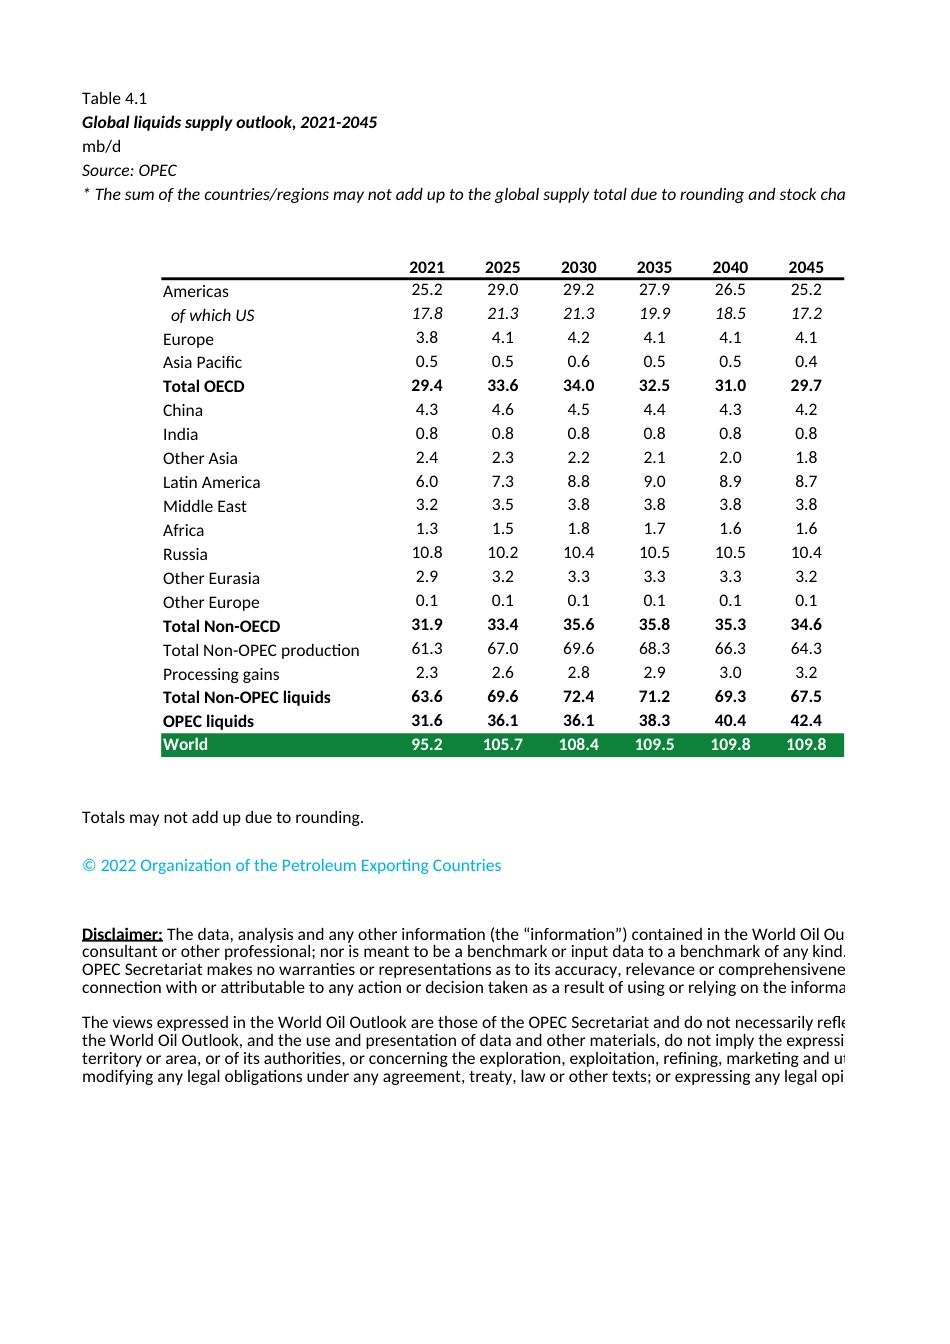
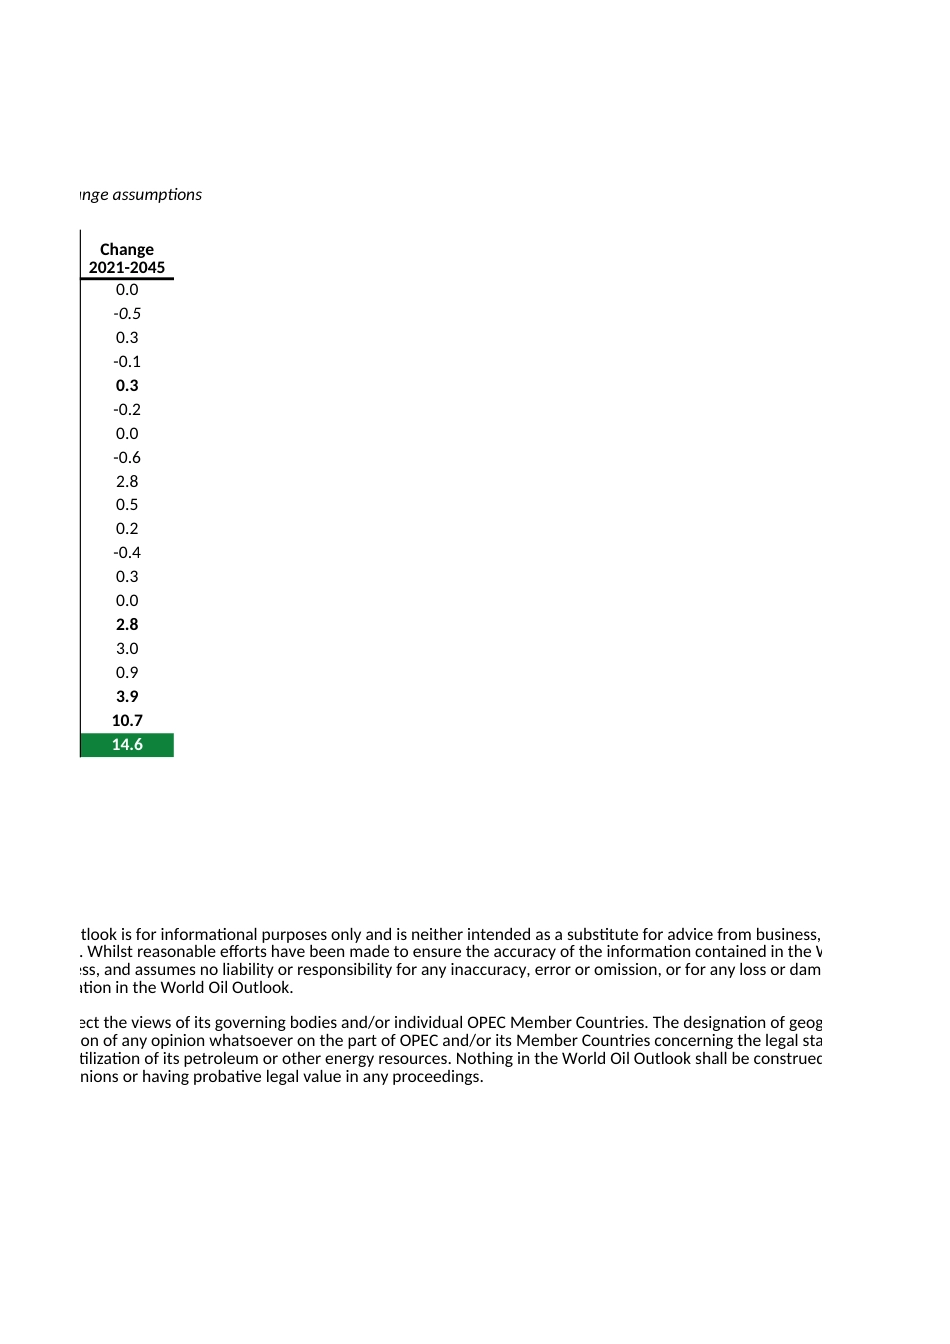
Table 4.1Global liquids supply outlook, 2021-2045mb/dSource: OPEC* The sum of the countries/regions may not add up to the global supply total due to rounding and stock change assumptio202120252030203520402045Americas25.229.029.227.926.525.2 of which US17.821.321.319.918.517.2Europe3.84.14.24.14.14.1Asia Pacific0.50.50.60.50.50.4Total OECD29.433.634.032.531.029.7China4.34.64.54.44.34.2India0.80.80.80.80.80.8Other Asia2.42.32.22.12.01.8Latin America6.07.38.89.08.98.7Middle East3.23.53.83.83.83.8Africa1.31.51.81.71.61.6Russia10.810.210.410.510.510.4Other Eurasia2.93.23.33.33.33.2Other Europe0.10.10.10.10.10.1Total Non-OECD31.933.435.635.835.334.6Total Non-OPEC production61.367.069.668.366.364.3Processing gains2.32.62.82.93.03.2Total Non-OPEC liquids63.669.672.471.269.367.5OPEC liquids31.636.136.138.340.442.4World95.2105.7108.4109.5109.8109.8Totals may not add up due to rounding.© 2022 Organization of the Petroleum Exporting CountriesDisclaimer: The data, analysis and any other information (the “information”) contained in the World Oil Outlook is for infoconsultant or other professional; nor is meant to be a benchmark or input data to a benchmark of any kind. Whilst reasonOPEC Secretariat makes no warranties or representations as to its accuracy, relevance or comprehensiveness, and assumeconnection with or attributable to any action or decision taken as a result of using or relying on the information in the WoThe views expressed in the World Oil Outlook are those of the OPEC Secretariat and do not necessarily reflect the views ofthe World Oil Outlook, and the use and presentation of data and other materials, do not imply the expression of any opiniterritory or area, or of its authorities, or concerning the exploration, exploitation, refining, marketing and utilization of its...