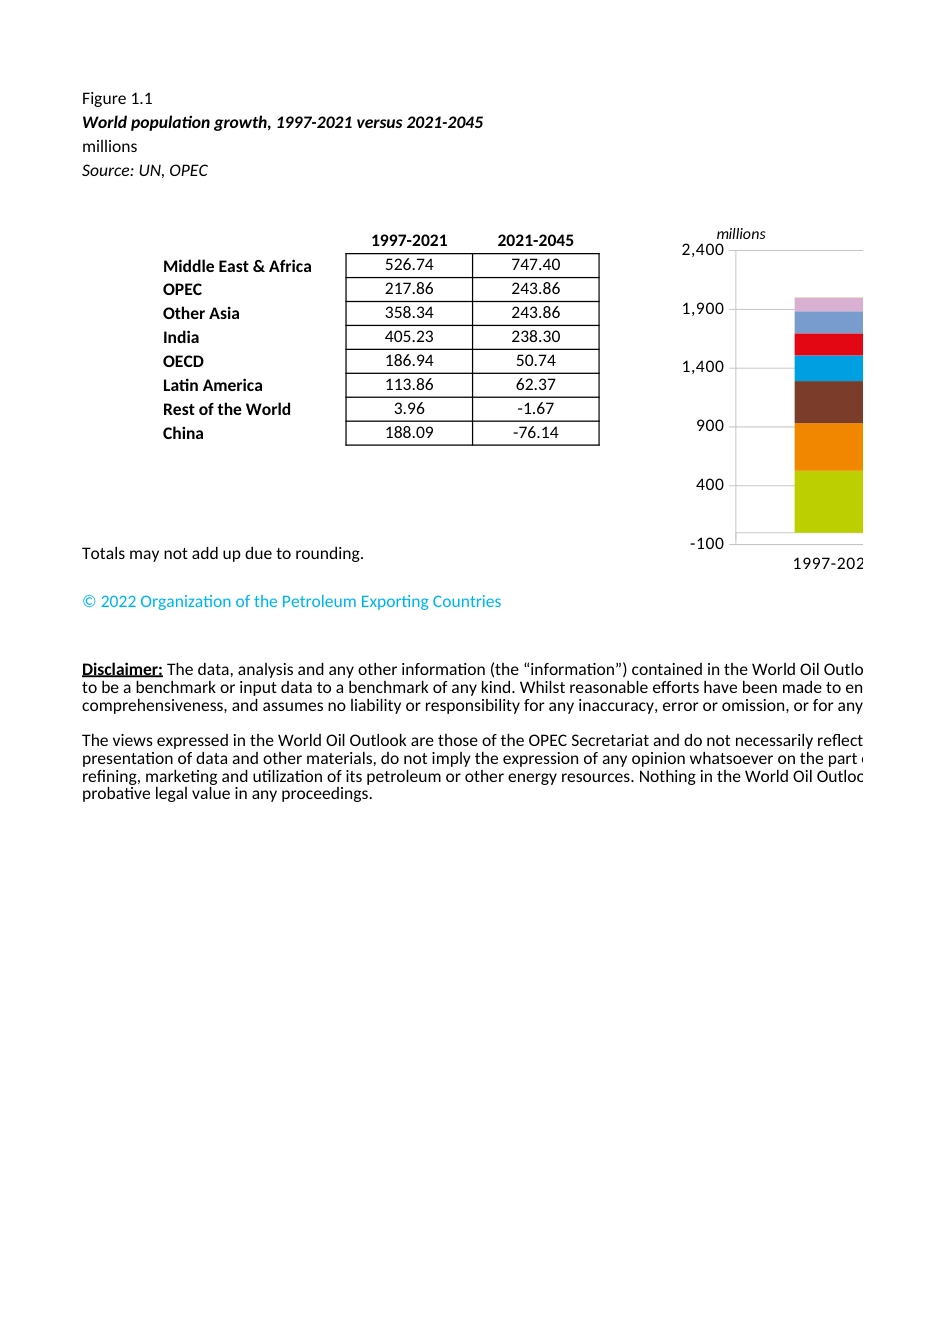
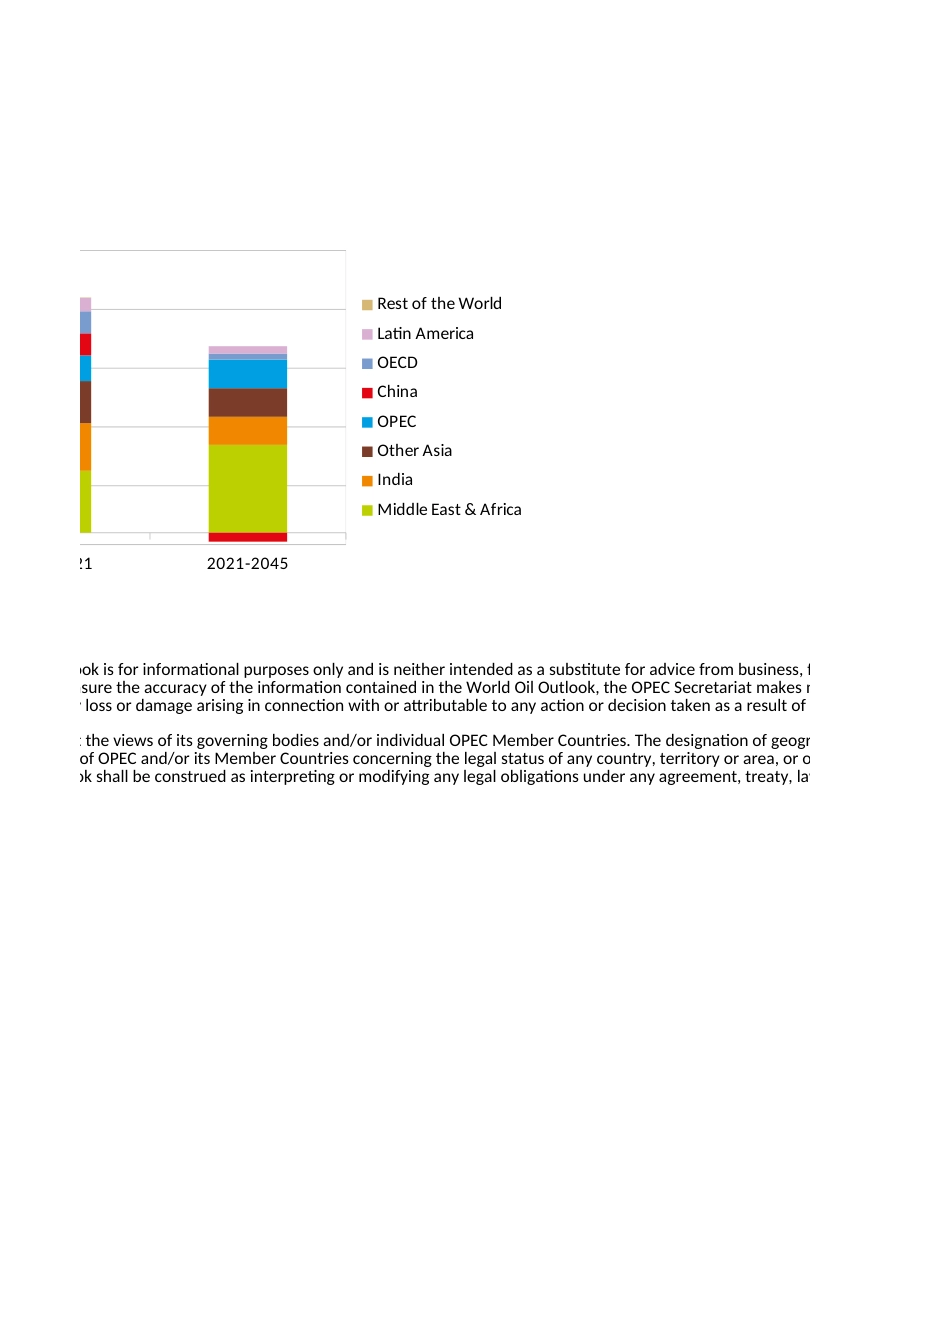
Figure 1.1World population growth, 1997-2021 versus 2021-2045millionsSource: UN, OPEC1997-20212021-2045Middle East & Africa526.74747.40OPEC217.86243.86Other Asia358.34243.86India405.23238.30OECD186.9450.74Latin America113.8662.37Rest of the World3.96-1.67China188.09-76.14Totals may not add up due to rounding.© 2022 Organization of the Petroleum Exporting CountriesDisclaimer: The data, analysis and any other information (the “information”) contained in the World Oil Outlook is for infoto be a benchmark or input data to a benchmark of any kind. Whilst reasonable efforts have been made to ensure the acccomprehensiveness, and assumes no liability or responsibility for any inaccuracy, error or omission, or for any loss or damaThe views expressed in the World Oil Outlook are those of the OPEC Secretariat and do not necessarily reflect the views ofpresentation of data and other materials, do not imply the expression of any opinion whatsoever on the part of OPEC and/refining, marketing and utilization of its petroleum or other energy resources. Nothing in the World Oil Outlook shall be coprobative legal value in any proceedings.1997-2021-1004009001,4001,9002,400millionsrld Oil Outlook is for informational purposes only and is neither intended as a substitute for advice from business, finance, investment made to ensure the accuracy of the information contained in the World Oil Outlook, the OPEC Secretariat makes no warranties or repn, or for any loss or damage arising in connection with or attributable to any action or decision taken as a result of using or relying on tsarily reflect the views of its governing bodies and/or individual OPEC Member Countries. The designation of geographical entities in thon the part of OPEC and/o...