欧盟清洁能源技术的总体战略分析2022:现状报告(英文版)VIP专享VIP免费

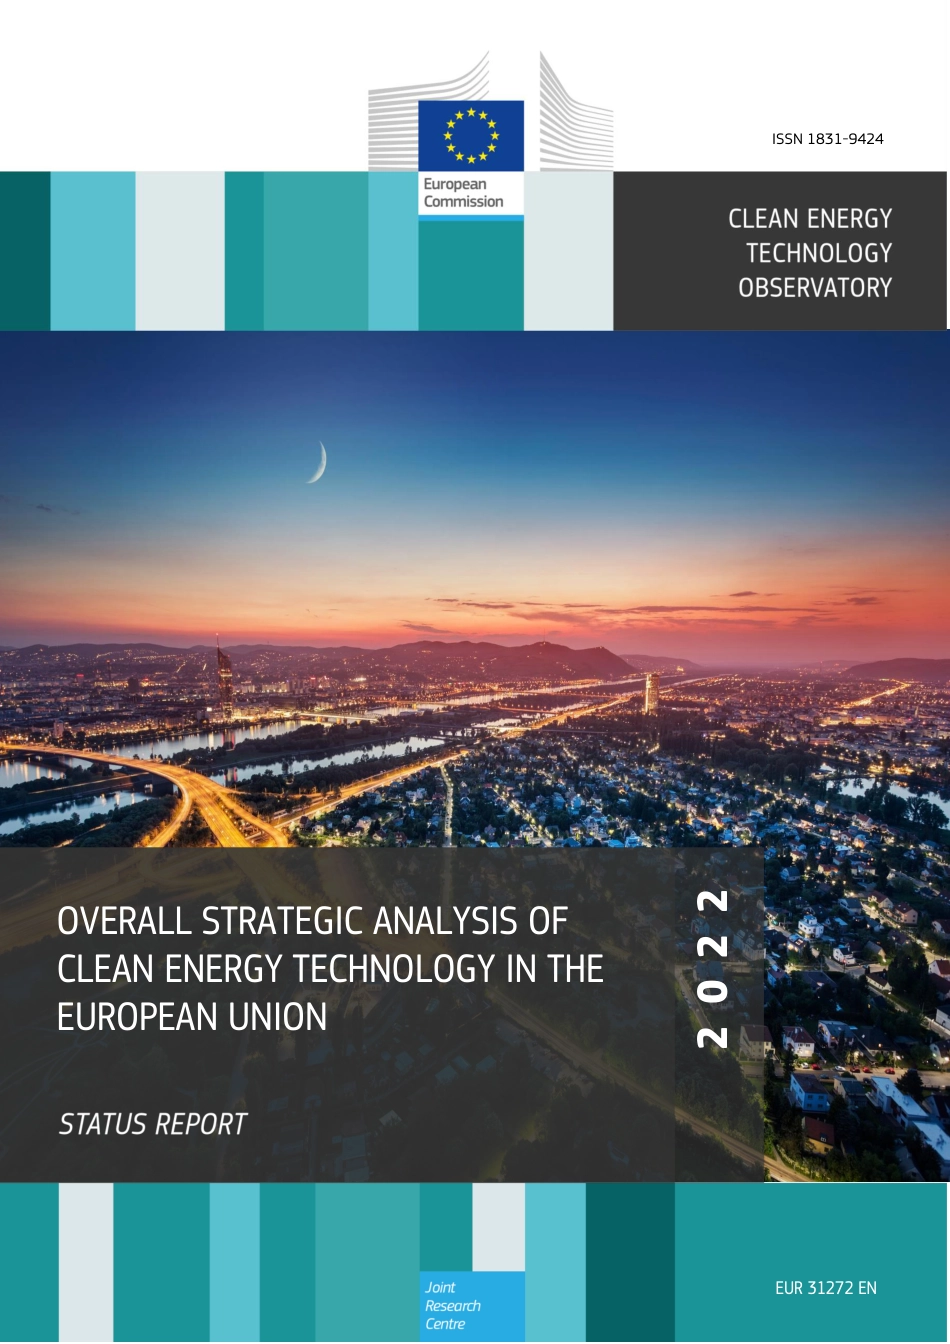
2 0 2 2
EUR 31272 EN
OVERALL STRATEGIC ANALYSIS OF
CLEAN ENERGY TECHNOLOGY IN THE
EUROPEAN UNION
ISSN 1831-9424
This publication is a Technical report by the Joint Research Centre (JRC), the European Commission’s science and knowledge service. It
aims to provide evidence-based scientific support to the European policymaking process. The contents of this publication do not
necessarily reflect the position or opinion of the European Commission. Neither the European Commission nor any person acting on
behalf of the Commission is responsible for the use that might be made of this publication. For information on the methodology and
quality underlying the data used in this publication for which the source is neither Eurostat nor other Commission services, users should
contact the referenced source. The designations employed and the presentation of material on the maps do not imply the expression of
any opinion whatsoever on the part of the European Union concerning the legal status of any country, territory, city or area or of its
authorities, or concerning the delimitation of its frontiers or boundaries.
Contact information
Name: Nigel TAYLOR
Email: nigel.taylor@ec.europa.eu
EU Science Hub
https://joint-research-centre.ec.europa.eu
JRC131001
EUR 31272 EN
PDF ISBN 978-92-76-58621-0 ISSN 1831-9424 doi:10.2760/12921 KJ-NA-31-272-EN-N
Luxembourg: Publications Office of the European Union, 2022
© European Union, 2022
The reuse policy of the European Commission documents is implemented by the Commission Decision 2011/833/EU of 12 December
2011 on the reuse of Commission documents (OJ L 330, 14.12.2011, p. 39). Unless otherwise noted, the reuse of this document is
authorised under the Creative Commons Attribution 4.0 International (CC BY 4.0) licence (https://creativecommons.org/licenses/by/4.0/).
This means that reuse is allowed provided appropriate credit is given and any changes are indicated.
For any use or reproduction of photos or other material that is not owned by the European Union permission must be sought directly from
the copyright holders. The European Union does not own the copyright in relation to the following elements:
- Cover page illustration, © AdobeStock_64567003
- Any other images so indicated in the body of the report
How to cite this report: Georgakaki, A., Letout, S., Kuokkanen, K., Mountraki, A., Ince, E., Shtjefni, D., Taylor, N., Schmitz, A., Vazquez Dias, A.,
Christou, M., Pennington, D., Mathieux, F., Clean Energy Technology Observatory: Overall Strategic Analysis of Clean Energy Technology in
the European Union 2022 Status Report, Publications Office of the European Union, Luxembourg, 2022, doi:10.2760/12921,
JRC131001.
EUR XXXXXXX
i
Contents
Foreword ..................................................................................................................................................................................................................................................................... 1
Acknowledgements .......................................................................................................................................................................................................................................... 2
Executive Summary ......................................................................................................................................................................................................................................... 3
1 Introduction..................................................................................................................................................................................................................................................... 6
2 Overall competitiveness of the EU clean energy sector ...................................................................................................................................... 8
2.1 Energy and resource trends .............................................................................................................................................................................................. 8
2.1.1 Production and trade .......................................................................................................................................................................................... 10
2.1.2 Costs and prices ...................................................................................................................................................................................................... 10
2.1.3 Raw materials, supply chains, commodity prices .................................................................................................................... 11
2.1.4 Carbon Pricing ........................................................................................................................................................................................................... 13
2.1.5 Energy poverty .......................................................................................................................................................................................................... 14
2.2 Research and innovation trends ................................................................................................................................................................................. 14
2.2.1 Public R&I spending ............................................................................................................................................................................................. 14
2.2.2 Private R&I spending .......................................................................................................................................................................................... 16
2.2.3 Research, Innovation and the Recovery and Resilience Plans ..................................................................................... 16
2.2.4 Patenting Activity ................................................................................................................................................................................................... 16
2.2.5 Scientific Publications ........................................................................................................................................................................................ 17
2.2.6 Coordinating R&I efforts in the EU and global context ..................................................................................................... 18
2.2.7 Venture Capital Investments in Climate Tech Firms and Clean Energy Technologies ......................... 19
2.3 Human Capital and Skills .................................................................................................................................................................................................. 27
2.3.1 Employment in clean energy ....................................................................................................................................................................... 27
2.3.2 Skills and training needs ................................................................................................................................................................................. 29
2.3.3 Gender balance ........................................................................................................................................................................................................ 30
2.3.4 Impact on conventional / fossil fuel energy employment............................................................................................... 30
2.4 Gross Value Added in clean energy ........................................................................................................................................................................ 31
2.4.1 Labour productivity .............................................................................................................................................................................................. 31
2.5 Social aspects and citizen engagement ............................................................................................................................................................. 32
3 Strategic analysis................................................................................................................................................................................................................................... 34
3.1 Critical materials and industrial value chains ............................................................................................................................................... 34
3.2 Sustainability ................................................................................................................................................................................................................................ 35
3.2.1 Status for environmental, social, economic and governance aspects ................................................................ 35
3.2.2 Concept and needs for an integrated sustainability assessment ........................................................................... 37
3.2.3 Roadmap for further sustainability assessments ................................................................................................................... 38
3.3 SWOT analysis ............................................................................................................................................................................................................................. 38
4 Conclusions .................................................................................................................................................................................................................................................. 42
List of abbreviations and definitions ........................................................................................................................................................................................... 43
List of figures ..................................................................................................................................................................................................................................................... 44
2022EUR31272ENOVERALLSTRATEGICANALYSISOFCLEANENERGYTECHNOLOGYINTHEEUROPEANUNIONISSN1831-9424ThispublicationisaTechnicalreportbytheJointResearchCentre(JRC),theEuropeanCommission’sscienceandknowledgeservice.Itaimstoprovideevidence-basedscientificsupporttotheEuropeanpolicymakingprocess.ThecontentsofthispublicationdonotnecessarilyreflectthepositionoropinionoftheEuropeanCommission.NeithertheEuropeanCommissionnoranypersonactingonbehalfoftheCommissionisresponsiblefortheusethatmightbemadeofthispublication.ForinformationonthemethodologyandqualityunderlyingthedatausedinthispublicationforwhichthesourceisneitherEurostatnorotherCommissionservices,usersshouldcontactthereferencedsource.ThedesignationsemployedandthepresentationofmaterialonthemapsdonotimplytheexpressionofanyopinionwhatsoeveronthepartoftheEuropeanUnionconcerningthelegalstatusofanycountry,territory,cityorareaorofitsauthorities,orconcerningthedelimitationofitsfrontiersorboundaries.ContactinformationName:NigelTAYLOREmail:nigel.taylor@ec.europa.euEUScienceHubhttps://joint-research-centre.ec.europa.euJRC131001EUR31272ENPDFISBN978-92-76-58621-0ISSN1831-9424doi:10.2760/12921KJ-NA-31-272-EN-NLuxembourg:PublicationsOfficeoftheEuropeanUnion,2022©EuropeanUnion,2022ThereusepolicyoftheEuropeanCommissiondocumentsisimplementedbytheCommissionDecision2011/833/EUof12December2011onthereuseofCommissiondocuments(OJL330,14.12.2011,p.39).Unlessotherwisenoted,thereuseofthisdocumentisauthorisedundertheCreativeCommonsAttribution4.0International(CCBY4.0)licence(https://creativecommons.org/licenses/by/4.0/).Thismeansthatreuseisallowedprovidedappropriatecreditisgivenandanychangesareindicated.ForanyuseorreproductionofphotosorothermaterialthatisnotownedbytheEuropeanUnionpermissionmustbesoughtdirectlyfromthecopyrightholders.TheEuropeanUniondoesnotownthecopyrightinrelationtothefollowingelements:-Coverpageillustration,©AdobeStock_64567003-AnyotherimagessoindicatedinthebodyofthereportHowtocitethisreport:Georgakaki,A.,Letout,S.,Kuokkanen,K.,Mountraki,A.,Ince,E.,Shtjefni,D.,Taylor,N.,Schmitz,A.,VazquezDias,A.,Christou,M.,Pennington,D.,Mathieux,F.,CleanEnergyTechnologyObservatory:OverallStrategicAnalysisofCleanEnergyTechnologyintheEuropeanUnion–2022StatusReport,PublicationsOfficeoftheEuropeanUnion,Luxembourg,2022,doi:10.2760/12921,JRC131001.EURXXXXXXXiContentsForeword.....................................................................................................................................................................................................................................................................1Acknowledgements..........................................................................................................................................................................................................................................2ExecutiveSummary.........................................................................................................................................................................................................................................31Introduction.....................................................................................................................................................................................................................................................62OverallcompetitivenessoftheEUcleanenergysector......................................................................................................................................82.1Energyandresourcetrends..............................................................................................................................................................................................82.1.1Productionandtrade..........................................................................................................................................................................................102.1.2Costsandprices......................................................................................................................................................................................................102.1.3Rawmaterials,supplychains,commodityprices....................................................................................................................112.1.4CarbonPricing...........................................................................................................................................................................................................132.1.5Energypoverty..........................................................................................................................................................................................................142.2Researchandinnovationtrends.................................................................................................................................................................................142.2.1PublicR&Ispending.............................................................................................................................................................................................142.2.2PrivateR&Ispending..........................................................................................................................................................................................162.2.3Research,InnovationandtheRecoveryandResiliencePlans.....................................................................................162.2.4PatentingActivity...................................................................................................................................................................................................162.2.5ScientificPublications........................................................................................................................................................................................172.2.6CoordinatingR&IeffortsintheEUandglobalcontext.....................................................................................................182.2.7VentureCapitalInvestmentsinClimateTechFirmsandCleanEnergyTechnologies.........................192.3HumanCapitalandSkills..................................................................................................................................................................................................272.3.1Employmentincleanenergy.......................................................................................................................................................................272.3.2Skillsandtrainingneeds.................................................................................................................................................................................292.3.3Genderbalance........................................................................................................................................................................................................302.3.4Impactonconventional/fossilfuelenergyemployment...............................................................................................302.4GrossValueAddedincleanenergy........................................................................................................................................................................312.4.1Labourproductivity..............................................................................................................................................................................................312.5Socialaspectsandcitizenengagement.............................................................................................................................................................323Strategicanalysis...................................................................................................................................................................................................................................343.1Criticalmaterialsandindustrialvaluechains...............................................................................................................................................343.2Sustainability................................................................................................................................................................................................................................353.2.1Statusforenvironmental,social,economicandgovernanceaspects................................................................353.2.2Conceptandneedsforanintegratedsustainabilityassessment...........................................................................373.2.3Roadmapforfurthersustainabilityassessments...................................................................................................................383.3SWOTanalysis.............................................................................................................................................................................................................................384Conclusions..................................................................................................................................................................................................................................................42Listofabbreviationsanddefinitions...........................................................................................................................................................................................43Listoffigures.....................................................................................................................................................................................................................................................44iiListoftables........................................................................................................................................................................................................................................................45Annexes....................................................................................................................................................................................................................................................................46Annex1CETOreportseries2022..........................................................................................................................................................................................46Annex2CETOsustainabilityassessmentcheck-list...............................................................................................................................................11ForewordThisreportisanoutputoftheCleanEnergyTechnologyObservatory(CETO).CETO’sobjectiveistoprovideanevidence-basedanalysisfeedingthepolicymakingprocessandhenceincreasingtheeffectivenessofR&Ipoliciesforcleanenergytechnologiesandsolutions.ItmonitorsEUresearchandinnovationactivitiesoncleanenergytechnologiesneededforthedeliveryoftheEuropeanGreenDeal;andassessesthecompetitivenessoftheEUcleanenergysectoranditspositioningintheglobalenergymarket.Assuch,CETOalsoconstitutestheevidence-basedanalysisunderpinningtheAnnualProgressReportonCompetitivenessofCleanEnergyTechnologies(CPR)undertheannualStateoftheEnergyUnionReport.CETOisbeingimplementedbytheJointResearchCentreforDGResearchandInnovation,incoordinationwithDGEnergy.2AcknowledgementsTheauthorsgratefullyacknowledgethesupportandcontributionsofGiuliaSerraandPabloRiesgoAbeledo(DGENER)andThomasSchleker(DGRTD),andtoFabioMonforti-FerrarioandSandorSzabo(JRC)fortheirreview.ThanksalsotoallthecolleagueswhoauthoredtheCETOreportscitedhere.AuthorsGeorgakaki,A.,Letout,S.Kuokkanen,A.Mountraki,A.Ince,E.Shtjefni,D.Taylor,N.Schmitz,A.VazquezDias,A.,Christou,M.Pennington,D.Mathieux,F3ExecutiveSummaryThisreportispartofanannualseriesfromtheCleanEnergyTechnologyObservatorythataddressthestatusoftechnologydevelopmentandtrends,valuechainsandmarketsintheEuropeanUnionandinternationally.Thepresentreportaimstoprovideanoverallintegratedanalysisofthecleanenergytechnologyandsystemintegration.Itaddressestwomainaspects:a)dataontheoverallcompetitivenessoftheEUcleanenergysectorandb)strategicanalysisofcriticalvaluechainsandsustainability.Thefollowingsummarisesthemainfindings:EnergyandResourcesTrends—Energyconsumptionandenergyintensityhavebeendecreasing,thelatteratamorerapidpace,indicatingmoreefficientuseofenergyanddecouplingofenergyconsumptionfromeconomicgrowth.In2020,theimpactoftheCOVID-19crisisontheEUeconomyledtoadecreaseinenergydemand.Asaresult,bothprimaryandfinalenergyconsumptionweremorethan5%belowtheEU2020targetlevel.Withthecontributionofincreasingrenewablesintheenergymix,GHGintensitieshavealsodecreased;theEUisoneoftheleastemittingmajorglobaleconomies.In2020,theEUexceededthetargetforrenewableshareingrossfinalenergyconsumptionby2%,achievingoneofthemilestonestowardsclimateneutrality.Nonetheless,in2021,theeconomicrecoverybroughtincreasesinenergyconsumption,aswellasenergyandcarbonintensityglobally,withenergydemandhigherthan2019levelsandemissionincreasesoffsettingthe2020drop.ThetrendalsoaffectstheEU,albeittoalesserextentthanothereconomies,soitwillbeimportanttoputinpracticethemeasuresenvisagedinpolicytomaintainacoursetoenergyefficiency,securityandclimateneutrality.—Duringthelastdecade,EUindustrialelectricityandgaspriceshavebeenhigherthaninmostnon-EUG20countries.MemberStateswithhigherimportdependencefacegreaterpricevolatilityandhigherprices.Beyondinterventionsonthetaxesandleviesthatmaymakeuppartofthecost,increasingtheshareofrenewableenergyproducedintheEUcouldmitigatecostsandtheirnegativeimpactonthecompetitivenessoftheEUindustry.—EconomicdataonthecleanenergysectorasawholeisavailablefromtheEurostatenvironmentalgoodsandservicesaccountsandmorespecificallyforrenewablesfromEurObserv’ER.TheEUrenewableenergysectorcontinuedtogrowdespitethepandemic,outperformingtheoveralleconomyintermsofgeneratedturnoverandgrossvalueadded.WhiletheEUeconomycontractedby4%in2020,grossvalueaddedofrenewableenergysectorincreasedby8%,andturnovergrewby9%in2019-2020,withwindandheatpumpvaluechainsbeingthemaindrivers.Asawhole,theenergysectorgeneratesabout4timesmorevalueaddedperEuroofturnoverthanthefossilfuelindustry.Moreover,ithasnearly70%higherratioofgrossvalueaddedtoturnoverthantheoverallmanufacturingindustryintheEU.—In2021,theEUproductionvalueofmostcleanenergytechnologiesandsolutionsbroadlyincreased,reversingthedecliningtrendof2020.Nevertheless,thesimultaneousincreaseofpricesstartingin2021maygiveanoverlypositivepictureofproductiongrowth.Inaddition,sometechnologiesexperiencedanincreaseofimportstomeetthegrowingdemandintheEU.—GlobalcarbonmarketinchedforwardatCOP26,butstillin2022lessthan4%ofglobalemissionsarecoveredbyadirectcarbonpricewhichisintherangeofEUR50-100/tCO2.TheEUEmissionsTradingSystem(EUETS),whichremainsthelargestcarbonmarketbytradedvalue,fallswithinthisrange,withanaveragepriceofEUR53/tCO2in2021andofEUR84/tCO2inthefirstsemesterof2022.In2021revenuefromETSforthefirsttimesurpassedcarbontaxrevenueglobally,increasingitsimportanceforfinancinglow-carboninnovationandtheenergytransition.HumanCapitalandSkills—Overallfrom2015to2020EUtotalemploymentintherenewableshasremainedatabout1.3million.Themainchangehasoccurredinthedistributionofjobsinthevarioussectors,withheatpumpsovertakingsolidbiofuelsandwindenergyasthebiggestemployerin2020.Whenenergyefficiencyande-mobilityareincluded,cleanenergysectoremploymentclimbsto1.8million(1%oftheEUtotalemployment),havingexpandedonaverageby3%annuallysince2015.Meanwhile,fossilenergyindustryemploymenthasdeclinedonaverageby2%annuallyinthelastdecade.—Thesupplychaindifficultiesandemploymentshortagesobservedintheeconomyduringtherecoveryfromthepandemichavealsospilledovertothecleanenergysector.Nearly30%ofbusinessesinmanufactureofelectricalequipmentintheEUexperiencedshortagesoflabourin2022.Inparticulartechnicalskillsareingrowingdemandacrosstheenergyindustry.TheEUistakingactiontoanswerskillsrelatedchallenges4posedbythedigital-greentwintransitionthroughitsoverarchingskillspolicyframeworkrepresentedbytheEuropeanSkillsAgenda.AlsotheCleanEnergyIndustrialForum(CEIF)commitstosteppingupeffortsandinvestmentsinthedevelopmentofskills,strengtheningreskillingandupskillingprogrammes.Theshortageofmaterialsandequipmentisevenmorepronouncedandaffectedover70%ofelectricalequipmentmanufacturingbusinessesintheEU.Thisisalsohigherthanfortheoverallmanufacturingindustry(53%affected)intheEU.—Agendergapcontinuestoprevailinthecleanenergysector,andconsistentandcontinuousgender-disaggregateddataislargelylacking.Forexample,womenareunder-representedinhighereducationinScience,Technology,Engineering,andMathematics(STEM)sub-fieldsthatarehighlyrelevantfortheenergysector,whichremainsheavilymaledominated.Thistranslatestolowershareofpatentapplicationswithwomeninventors(only20%inallpatentclassesin2021andjustover15%forclimatechangemitigationtechnologies),lowershareofstart-upsfoundedorco-foundedbywomen(lessthan15%intheEUin2021),andloweramountsofcapitalinvestedintowomen-ledcompanies(only2%inall-femalestart-upsand9%inmixedteamsintheEUin2021),creatingaviciouscircle.Therearehoweveranincreasingnumberofinitiativesstimulatingwomen’sinvolvementininnovation,suchasthesecondeditionofWomenTechEUlaunchedbytheEUin2022andnewgender-balancecriterionincludedunderHorizonEurope.ResearchandInnovationTrends—TheEUisatforefrontincleanenergyresearchandinnovation.With6%oftheworldpopulation,itisagloballeaderfor‘green’inventionsandhigh-valuepatentsinclimatechangemitigationtechnologies.Asregardstonoveltechnologies,EUclimate-techstart-upsandscale-upshaveattractedanincreasingamountofventurecapital(VC)investmentsoverthelast6years,accountingfor15%ofglobalclimatetechVCinvestmentsin2021,morethanatwofoldincrease(x2.2)ascomparedto2020.2021wasalsothefirstyearwherelater-stageinvestmentsinEU-basedclimatetechwerehigherthanthoseinChina.However,early-stageinvestmentsreachednewhighsintheUSandChinain2021butpeakedintheEU.Thisremainsagoodperformanceinaracewhereinvestmentsaresurgingaroundtheworldandmegadealsaredrivingmuchofthetoplineinvestmentgrowth.Structuralbarriersandsocietalchallenges1arehoweverstillholdingbackEU-basedclimatetechscale-upscomparedtoothermajoreconomies.—PublicR&IinvestmentsintheMemberStatesincreasedbothintermsofabsolutespendingandasashareofGDPin2020.However,theystillremainbelowEU2010levelsinabsolutetermsandalsoasashareofGDPcomparedtoothermajoreconomies.Nevertheless,EUR&Ifundshaveincreasedsignificantly.In2020,frameworkprogrammefundsaccountedforathirdofpublicinvestmentintheEnergyUnionR&Ipriorities,providingavitalboosttoresearchandinnovation.ConsideringbothMSandframeworkprogrammefunding,in2020,theEUwassecondinpublicR&Iinvestmentamongmajoreconomies,bothinabsolutespending:EUR6.6billion(wheretheUSleadswithEUR8billion)andasshareofGDP:0.046%,behindJapan0.058%andjustaheadofUSandKR.CriticalMaterialsandIndustryValueChainsAvailabilityofthenecessaryrawmaterialsandsmoothfunctioningoftherelevantvaluechainsisessentialfortheundisrupteddeploymentofthecleanenergytechnologies,fulfillingtheEUenergytransitiontargets.ThematerialsandvaluechainsnecessaryforeachtechnologyhavebeenanalysedintheCETOreportsonspecifictechnologies.Variousmaterialshavebeenidentifiedascriticalandstrategic,includingsteel,cement,copper,rareearths,compositematerials,ironalloys,siliconmetal,silver,lithium,nickel,graphite,cobalt,etc.AchievingtheREPowerEUpolicytargetswouldnaturallyleadtoanincreaseinthedemandforrawmaterials,processedmaterials,componentsandassemblies.ItiswidelyrecognisedthattheEUneedstostrengthensupplychainsandimproveitsresilienceconcerningcriticalmaterialsandcomponents,andtheStateoftheUnionaddressinSeptember2022includedaproposalforaEuropeanCriticalRawMaterialsActSustainabilityEnergysystemsmustbesustainableintermsoftheirenvironmental,socialandeconomicperformance.AspartoftheCETOanalysisofindividualtechnologiesandsystemintegrationaspects,datahasbeengatheredinasystematicwayonanextensiveseriesofrelevantparameters.Thesequalitativeandquantitativeanalysesofsustainabilityperformancefhighlighttheheterogeneousandlimitednatureofavailableinformationanddata.Methodologiesused(e.g.PECFRforLifeCycleAssessment)arealsonotavailableforalltechnologies.They1Asanalysedin:COM(2020)953final,ReportonProgressofCleanEnergyCompetitiveness,andCOM/2022/332final,TheNewInnovationAgenda.5equallyhighlightthatdifferentcategoriesofconsiderationsarerelevantdependingonthetechnologyfore.g.directimpactsandperceptions.Fromalifecycleassessmentperspective,includingforcarbonfootprints,datacanbelimitedforsometechnologiesandmayalsonotbebasedondetailedanalysisrequirements.Specificexamplesaregivenforbatteries,photovoltaicsandwindtechnologies.ItisrecommendedthattheCETOqualitativeanalysesshouldbefurtherexpandedandmaintainedthroughmoredetailedstudiesbutfocusingonalimitedsubsetofparameters.Itmaybegoodtomakecleardistinctionsbetweeneconomic,social,andenvironmentalconsiderations.Equally,asplitcanbemadebetweendirectimpactsandthoseassociatedwithvaluechains.Atthesametime,developmentisrecommendedofquantitativemodellingforanalysisofvaluechainsandoffuturepotentialforselectedcleanenergytechnologiesforselectedpolicyendpoints(autonomy,circularity,climate,environmental,socialandeconomic).Thiscouldbedoneinitiallyforthemostdominantcleantechnologies,buildingone.g.examplesofmoreadvancedvaluechainanalyses/modellingsuchasforbatteries.61IntroductionThisreportispartofanannualseriesfromtheCleanEnergyTechnologyObservatorythataddressthestatusoftechnologydevelopmentandtrends,valuechainsandmarketsintheEuropeanUnionandinternationally.Itaimstoprovideanoverallintegratedanalysisofthecleanenergytechnologyandsystemintegration,tocomplementtheindividualtechnologyandsystemintegrationreports(listedinAnnex1).AssetoutintheCETOtermsofreference,itaddressestwomainaspects:a)ConsolidateddataonthecompetitivenessoftheEUcleanenergysector,addressingEnergyandResourcesTrends(includingenergyintensity,shareofrenewables,tradebalance,electricity,carbonandfuelprices,andturnover)HumanCapitalandSkillsResearchandInnovationTrends(investments,patents)b)Strategicanalysis,addressing:Mediumandlong-termperspectivesforcleanenergytechnologydevelopmentCriticalindustrialvaluechainrelationshipsSustainability(statusforenvironmental,social,economicandgovernanceaspects,integratedassessmentneedsandroadmapforfurtherassessments)ImpactofRecoveryandResiliencePlans(RRPs)SWOTanalysisforglobalcompetitiveness,technologyindependenceandsustainabilityThereportmakesuseoftheanalysisperformedfortheEuropeanclimateNeutralIndustryCompetitivenessScoreboard(CINDECS)2andtheworkreportedintheAnnualSingleMarketReport2021regardingEUIndustrialEcosystems3.Table2showstherelationshipsbetweentheCETOtechnologiesandsystemintegrationtopicsandtheserelatedactivities.Concerningpartb),forthisfirstannualreportfocusisrestrictedtocriticalmaterialsandindustrialvaluechains,tosustainabilityandtheSWOTanalysis.ThestatusofcleanenergytechnologyinvestmentsintheRRPsissummarisedinsection2.2.3–atthisstageitisprematuretoassessspecificimpacts.2Kuokkanen,A.,Georgakaki,A.,Mountraki,A.,Letout,S.,Telsnig,T.,Kapetaki,Z.,Quaranta,E.,Czako,V.andPasimeni,F.,EuropeanClimateNeutralIndustryCompetitivenessScoreboard(CINDECS)-AnnualReport2021,EUR31183EN,PublicationsOfficeoftheEuropeanUnion,Luxembourg,2022,ISBN978-92-76-55804-0,doi:10.2760/5869,JRC1293363EuropeanCommissionSWD(2021)351Updatingthe2020NewIndustrialStrategy:BuildingaStrongersingleMarketforEurope’sRecovery.7Table1.CoverageofcleanenergytechnologiesinCETO,CINDECSandbytheEUIndustrialEcosystems.CETOtechnologyandsystemintegrationareasRelevantCINDECStopics4MostRelevantEUIndustrialEcosystemsAdvancedbiofuelsRenewableenergyBatteriesBatteries(Li-ion)Mobility,Transport,AutomotiveBioenergy(solidbiomassandbiogasforheatandpowerandforintermediatecarriers)RenewableenergyCarbonCaptureUtilisationandStorageDecarbonisationofcementthroughCCSEnergyIntensiveIndustriesConcentratedSolarPowerandHeat-RenewableenergyGeothermalheatandpower-RenewableenergyHeatPumpsHeatpumpsRenewableenergyHydropower&PumpedHydropowerStorageHydropowerRenewableenergyNovelElectricityandHeatStoragetechnologies-OceanenergyOffshoreoperationsforREinstallationsRenewableenergyPhotovoltaicsSolarPVpanelsRenewableenergyRenewableFuelsofnon-biologicalorigin(other)AmmoniaasafuelRenewableenergyRenewableHydrogen-SolarFuels(direct)-RenewableenergyWind(offshoreandonshore)WindrotorsOffshoreoperationsforREinstallationsRenewableenergyBuilding-relatedcleanenergytechnologiesPre-fabricatedbuildingsSuperinsulationmaterialsBuildingenvelopetechnologiesCoolingandairconditioningConstructionDigitalinfrastructureforsmartenergysystemEVcharginginfrastructureDigitalIndustrialandDistrictHeat&ColdManagementHeatingandcoolingnetworkEnergyIntensiveIndustriesOff-gridenergysystems(includingislands)DigitalTransmissionandDistributionrelatedtechnologiesEMSforgridsDigitalElectronicsSmartCitiesEVcharginginfrastructureInnovativeenergycarriersandenergysupplyfortransportMobility-transport-automotiveSource:JRC4CINDECSalsoincludestopicsonfuelcellsandonelectricpowertrainsnotincludedinCETO82OverallcompetitivenessoftheEUcleanenergysector2.1EnergyandresourcetrendsWhenlookingatrecentdevelopmentsinthecleanenergytechnologysector,itisrelevanttoreportonsomeoverarchingindicatorsthataredependentontheprogressofthesectorbutcanalsoequallyaffectitsprosperityastheyimpactthecompetitivenessoftheEUindustryandeconomyasawhole(Figure1).Energyconsumptionandenergyintensityhavebeendecreasing,thelatteratamorerapidpace,indicatingmoreefficientuseofenergyanddecouplingofenergyconsumptionfromeconomicgrowth.In2020,theimpactoftheCOVID-19crisisontheEUeconomyledtoadecreaseinenergydemand.Asaresult,bothprimaryandfinalenergyconsumptionweremorethan5%belowtheEU2020targetlevel.Withthecontributionofincreasingrenewablesintheenergymix,GHGintensitieshavealsodecreased;theEUisoneoftheleastemitting,perGDP,amongmajorglobaleconomies5.In2020,theEUexceededthetargetforrenewableshareingrossfinalenergyconsumptionby2%,achievingoneofthemilestonestowardsclimateneutrality.Nonetheless,in2021,theeconomicrecoverybroughtincreasesinenergyconsumption,aswellasenergyandcarbonintensityglobally,withenergydemandhigherthan2019levelsandemissionincreasesoffsettingthe2020drop6,7.ThisisalsothecasefortheEU,albeittoalesserextentthanothereconomies.JRCdataconfirmsthat,in2021fossilfuelCO2emissionsintheEUincreased,butonlytohalfthelevelofthereductionbetween2019and20207..Goingforward,itwillbeimportanttoputinpracticethemeasuresenvisagedinpolicytomaintainacoursetoenergyefficiency,securityandclimateneutrality.Despitetheachievementsinreducingenergyconsumptionandintensity,in2019,theEUnet(energy)importdependencywasata30-yearhigh.In2020,importsofenergyproductsdecreasedandimportdependencyreturnedtojustbelow2005levels.Russia’sunprovokedaggressioninUkraine,highlightedtheneedtoreduceimportdependencyingeneral,andendtheEU’srelianceonRussianfossilfuelsinparticular(Figure2).Thisyear,thecountry-specificrecommendationsadoptedinthecontextoftheEuropeanSemesterincludeguidanceonreducingthedependencyonfossilfuels,inlinewiththeREPowerEUprioritiesandtheEuropeanGreenDeal.5TheEuropeanRoundTableforIndustry(ERT),EuropeanCompetitivenessandIndustryBenchmarkingReport20226Enerdata–GlobalEnergyandClimateTrends2022Edition7CrippaM.,GuizzardiD.,BanjaM.,SolazzoE.,MunteanM.,SchaafE.,PaganiF.,Monforti-FerrarioF.,Olivier,J.G.J.,Quadrelli,R.,RisquezMartin,A.,Taghavi-Moharamli,P.,Grassi,G.,Rossi,S.,Oom,D.,Branco,A.,San-Miguel,J.,Vignati,E.CO2emissionsofallworldcountries–JRC/IEA/PBL2022Report,PublicationsOfficeoftheEuropeanUnion,Luxembourg,2022,doi:10.2760/07904,JRC1303639Figure1:Evolutionofmainindicatorsforenergyconsumption,GHGintensityandrenewablecontributiontotheenergysystem,alongwiththe2020valueand2030targets.Source:JRCbasedonEnergyStatisticaldatasheetsandEurostat8Figure2:Importsofoilandpetroleumproducts,naturalgas,andsolidfossilfuelstotheEU,bysource,andimportingMemberState(thisisnotnecessarilytheend-userastheremaybetransformationsandre-exportswithintheEU),2019.Source:JRCbasedonEurostatdata98EUenergystatisticalpocketbookandcountrydatasheetshttps://energy.ec.europa.eu/data-and-analysis/eu-energy-statistical-pocketbook-and-country-datasheets_en;Eurostat(nrg_ind_eff),(nrg_ind_ren)9Eurostattables[nrg_ti_gas],[nrg_ti_sff],[nrg_ti_oil].Graphbuildwithsankeymatic.com.2019valuesarerepresentativeofpreviousyears,2020isanoutlier;thesecondsupplierofnaturalgasis“notspecified”butitisverylikelyRussia(mostlytoGermanyandAustria);Cyprusdoesnotimportnaturalgas,anominalvalueisaddedtoconstructthediagram;idemforMaltaonsolidfossilfuels102.1.1ProductionandtradeIn2021,theEUproductionvalueofmostcleanenergytechnologiesandsolutionsexperiencedawidelypositiveincrease,areversingtrendcomparedtothe2020decline.TheEUproductionofbatterieshadastaggeringyearwithproductionvaluequadruplingwithrespectto2020valuesasmorecapacitycameonline.Theheatpump,windandsolarPVproductionregistereda30%growthin2021:forheatpumpsitwasarecordyear,windbouncedbacktopre-pandemiclevel,whilstsolarPVreversedthedecliningtrendseensince2011.Theproductionofbiofuels,mainlybiodiesel,grewby40%,andincreasedwidelyacrossMemberStates,whileproductionofbioenergy,suchaspellets,starchresiduesandwoodchips,increasedby5%.Theproductionofhydrogen10grewbynearly50%astheNetherlandsmorethandoubleditsproductionin2021.Nevertheless,thesimultaneousincreaseofpricesstartingin2021maygiveanoverlypositivepictureofproductiongrowth.Inaddition,sometechnologiesexperiencedanincreaseofimportstomeetthegrowingdemandintheEU.In2021,importsforwindenergyandheatpumpsdoubled,whileimportsofsolarPValsoincreasedby40%.Nonetheless,extra-EUexportsinanumberoftechnologies,suchasbatteriesandwindalsoincreasedsignificantly,by74%and42%respectively,incontrasttobiofuelexports,whichcontinuedtoshrink.Heatpumpshadthemostsignificantrelativeincreaseintradedeficit(EUR390millionin2021vsEUR40millionin2020),followedbybiofuels(EUR2.3billionin2021vsEUR1.4billionin2020)andsolarPV(EUR9.2billionin2021vsEUR6.1billionin2020).Theincreasingdomesticbatteryproductionisfarfromkeepingupwithexpandingdemand,alsoresultingtoanincreasedtradedeficit(EUR5.3billionin2021vsEUR4.2billionin2020).Incontrast,theEUmaintainedpositivetradebalanceinwindenergytechnology(EUR2.6billionin2021vsEUR2billionin2020).Finally,whilethevolumeofimportedhydrogen11doubled,exportsalsoincreased,resultingintheEUmaintainingaslightlypositivetradebalance.2.1.2CostsandpricesAsstatedinpreviouscompetitivenessreports12,duringthelastdecade,EUindustrialelectricityandgaspriceshavebeenhigherthaninmostnon-EUG20countries.MemberStateswithhigherimportdependencefacegreaterpricevolatilityandhigherprices.Beyondinterventionsonthetaxesandleviesthatmaymakeuppartofthecost,increasingtheshareofrenewableenergyproducedintheEUcouldmitigatecostsandtheimpactonthecompetitivenessoftheEUindustry.Figure3providesasnapshotoflevelizedcostsofelectricity(LCOE)calculationsfortheyear2021forarangeofrepresentativeconditions13acrosstheEU.Theresultsindicatethatin2021technologyfleetswithlowvariablecosts(incl.variableoperationalcostsandfuelcosts)havebeenhighlycostcompetitive.Thisfindingismostrobustforsolar-andwind-poweredgenerationwithLCOEintherangeof40to60EuroperMWh,highlightsthehighcost-competitivenessofcleanenergytechnologies.Furthermore,theCombinedCycleGasTurbine(CCGT)fleetappearsmorecompetitiveonaveragein2021thancoal-firedgenerationthankstosignificantlyhighercapacityfactorsresultingfrompreferreddispatchinthefirstthreequartersof2021andafuelswitchonlyfactoringintowardsthefourthquarterof202114.Duringthefirstquarterof2022,theriseofgaspricescontinuedtosupportthegas-to-coalswitching,despitetheincreaseincarbonprices.However,thehighcoalpricesinthebeginningofthesecondquarterof2022startedtoclosethegapandrecentannouncementbysomeMemberStatestoincreasetheuseofcoal-firedplantshaveledtoexpectationsoffurtherpricerisesforcoalinthecomingmonths.10Referringtoallhydrogen,irrespectiveofproductionroute.11Referringtoallhydrogen,irrespectiveofproductionroute.12ReportfromtheCommissiontotheEuropeanParliamentandtheCouncilon’ProgressonCompetitivenessofcleanenergytechnologies’(firstedition:COM(2020)953final;secondedition:COM(2021)952final).13Datapointsshownforfirsttothirdinter-quartilerangetofilterforoutliers.14Themodelledcapacityfactorscouldoverestimateactualfuelswitchingandthusdifferencesincapacityfactorstosomeextent(seesection2.1inhttps://publications.jrc.ec.europa.eu/repository/handle/JRC127862).11Figure3:Snapshotoftechnology-fleetspecificlevelisedcostsofelectricity(LCOE)fortheyear2021.ThelightbluebarsdisplayarangeacrosstheEU27andthesolidbluelinesdenotemedian.Source:JRCMETISmodelsimulation,2022152.1.3Rawmaterials,supplychains,commoditypricesTheimplementationoftheGreenDealandREPowerEUsetanambitiousvisionfortheEUtophaseoutfossilfuelsbyacceleratingthegreenenergytransitionandintensifyingtherolloutoftechnologies,suchaswindandsolarPV.Thisincreaseddemandforcleanenergytechnologydeploymentwillalsoincreasethedemandforresources,suchasmetalsandmineralsnecessaryforthesetechnologies.Examplesincludewind(permanentmagnetsusingrare-earthelements),solarPV(Si-metal,Ag,Ge,Ga,In,Cd),batteries(Co,Li,graphite,Mn,Ni)16.Worldwide,theIEAforecaststhatthetotalmineralsdemandduetothedeclaredrenewablesrolloutissettodoubleorevenquadrupleby204017,whileglobaldemandforcertainprocessedrawmaterialsforbatteriesisexpectedtoincreaseupto20timesby2040TheCOVID-19pandemicandtheenergycrisisexacerbatedbytheRussianinvasioninUkraineledtosupplychainsdisruptionandpriceincreasesforthoseresourcesandmineralswithstrategicapplicationsforthetwingreenanddigitaltransitionincludinge.g.titaniummetal,palladium,aluminium,nickel,magnesium,silicon,noblegasesandrareearths.Surgingrawmaterialpricescanaffectthecostcompetitivenessofcleanenergytechnologiesandthushaveanegativeimpactontheirroll-out.Thepriceofcommoditieslikelithiumandcobaltmorethandoubledin2021,whilethoseforcopperandaluminiumalsoincreasedbyaround25%to40%18.Inthesameyear,thetrendofcostreductionsforwindturbinesandPVmoduleswasreversed;bothincreasedby9%and16%respectively,comparedto2020,whilesimilarincreasesareexpectedforbatteries19.Anemergingchallengeistoavoidexchangingfossilfueldependencytoresourcedependencyonexportedrawmaterialsandtechnologicalexpertisefortheirprocessingandcomponentsmanufacturing.Forinstance,China,hasanearmonopolyonminingandprocessingcertainREE,combinedwithastrongmarketpositionwithincertaincleanenergytechnologiesproductionchain.Intermsofresourcedependency,thechallengeisthreefold.Firstly,theEUfacesanincreasedcompetitionforgainingaccesstocriticalrawmaterialsastheothercountries15Kanellopoulos,K.,DeFelice,M.,Busch,S.andKoolen,D.,Simulatingtheelectricitypricehikein2021,EUR30965EN,PublicationsOfficeoftheEuropeanUnion,Luxembourg,2022Computationbasedonannualisedcostsfortheyear2021.CapexandOpexbasedonthe2020PRIMESreferencescenario,annualisedbytechnicallifetimesandweightedaveragecostofcapital.AnnualisedcostsarelevelisedusingcapacityfactorsderivedfromtheMETISmodel.Variablecostsarebasedon2021commodityprices,variableOPEXandthedispatchintheMETISsimulation.16CriticalRawMaterialsforStrategicTechnologiesandSectorsintheEU-AForesightStudy,https://ec.europa.eu/docsroom/documents/4288217IEA,TheRoleofCriticalMineralsinCleanEnergyTransitions,RevisedVersioninMay,2022.18IEA,Criticalmineralsthreatenadecades-longtrendofcostdeclinesforcleanenergytechnologies,2022,19IEA,TheRoleofCriticalMineralsinCleanEnergyTransitions,RevisedVersioninMay,2022.ERR能研微讯微信公众号:Energy-report欢迎申请加入ERR能研微讯开发的能源研究微信群,请提供单位姓名(或学校姓名),申请添加智库掌门人(下面二维码)微信,智库掌门人会进行进群审核,已在能源研究群的人员请勿申请;群组禁止不通过智库掌门人拉人进群。ERR能研微讯聚焦世界能源行业热点资讯,发布最新能源研究报告,提供能源行业咨询。本订阅号原创内容包含能源行业最新动态、趋势、深度调查、科技发现等内容,同时为读者带来国内外高端能源报告主要内容的提炼、摘要、翻译、编辑和综述,内容版权遵循CreativeCommons协议。知识星球提供能源行业最新资讯、政策、前沿分析、报告(日均更新15条+,十年plus能源行业分析师主理)提供能源投资研究报告(日均更新8~12篇,覆盖数十家券商研究所)二维码矩阵资报告号:ERR能研微讯订阅号二维码(左)丨行业咨询、情报、专家合作:ERR能研君(右)视频、图表号、研究成果:能研智库订阅号二维码(左)丨ERR能研微讯头条号、西瓜视频(右)能研智库视频号(左)丨能研智库抖音号(右)12stepupeffortstobuildupcapacity,potentiallyalsorestrictingexports.Halfofthe30CriticalRawMaterialslistedbytheEU20areimportedinmorethan80%pervolume.Circularityandsecondaryrawmaterialareoftenseenasawaytomitigatesupplyriskofmaterials,alsoconsideringthatrecyclingisaformalriskreducingfactorinthecriticalitycalculation21.BoostingthesupplyofsecondarymaterialsthroughrecyclingisanimportantpartoftheEUrawmaterialsinitiative22andthe2020circulareconomyactionplan(CEAP23).Recycling’scontributiontomeetingdemandisoverallgenerallylow:secondaryrawmaterialsgenerallyrepresentasmallshareofmanufacturinginputs.Onlyinafewcases,especiallyofbasemetals,doestheavailabilityofsecondarymaterialsapproachorsurpassonethirdofcurrentdemand(e.g.rhenium,tungsten,iron,tinandzinc),andonlyinonecasedoesitreachabove50%(lead).Recyclingisextremelylow(bothintermsofthefractionrecycledandofabsolutevalue)formostofthespecialitymetals.Thecontributionofsecondaryrawmaterialstomeetingmanufacturingneedsheavilydependsontheevolutionofdemand,andotherfactorscurrentlylimittheiravailability,including:economicortechnicalfeasibility,collectionrates,lifetimeofproductsorlossesinmanufacturingoruse24.Secondaryrawmaterialsalonewillnotbesufficienttoaddressthehighdemandinthetransitiontogreenanddigitaleconomy,duetodramaticallyrisingdemand,andlimitedavailabilityofsecondaryrawmaterials.Thisisforexamplethecaseforrawmaterialsforbatteries25andthisiswhytheyaresomeambitiousrecycledcontenttargetsintheBatteryregulationproposal,inparticularforlithium,cobaltandcopper.Thecontributionofresourceefficiencyandofrecyclingisverylikelytoincreaseinthefuture.Innovativedesignforrecyclabilityofproductswillalsoplayanimportantrole.Althoughthereistheoreticalpotentialtocoverbetween5and55%ofEurope’s2030needsbyextractionofrawmaterialsfromEuropeangrounds,aboostindomesticminingcapabilitiesmightencounterobstaclesduetopermittingproceduresandenvironmentalconcerns.TheREPowerEUplanidentifiesanumberofmeasurestostrikeabalancebetweendomesticsourcinganddiversifiedresourceimports.Ithighlightstheneedtopromoteresourceefficiencyandcircularitytogetherwithestablishingandstrengtheningthecooperationonrawmaterialsvaluechainswithchosenpartners,whileensuringahighlevelofenvironmentalprotectioninresourceexploitation26.TheActionPlanonCriticalRawMaterials27,GlobalGatewayinitiative28andreformulationofTradeandSustainableDevelopmentapproachregardingEU’stradeagreements29alsoaddressthediversificationandsustainabilityofsupply,whiletheEuropeanRawMaterialsAlliancewillstrengthendomesticsourcingofminerals,withthepotentialtoprioritiseminingprojectsinregionswheretheskillsandknow-howarealreadypresent30.Inaddition,astrategicapproachtoinnovationcanhaveacrucialrole,toincreasetechnologyperformanceandcircularity,anddecreasetheircostandmaterialneedswhilealsoprovidingalternativesformaterialsourcingandsubstitution.TheCircularEconomyActionPlan31,theActionPlanonRawMaterials32,andparticipationininternationalinitiativessuchastheMaterialsforEnergy33,willidentifyinvestmentneedsandguideandaccelerateR&Ieffortsonrecyclingmeasures,rawmaterialsefficiencyandalternatives,andnoveltyminingtechnologies.InMarch2022theEuropeanCouncil’sVersaillesdeclaration34calledforastepupofactiontoreducedependenciesandreinforce20COM(2020)474final,CriticalRawMaterialsResilience:ChartingaPathtowardsgreaterSecurityandSustainability.21Blengini,G.A.,etal.,EUmethodologyforcriticalrawmaterialsassessment:Policyneedsandproposedsolutionsforincrementalimprovements,ResourcePolicy,Volume53,September2017,Pages12-19https://www.sciencedirect.com/science/article/pii/S0301420717300223?via%3Dihub22Seehttps://single-market-economy.ec.europa.eu/sectors/raw-materials/policy-and-strategy-raw-materials_en23Seehttps://environment.ec.europa.eu/strategy/circular-economy-action-plan_en24RawMaterialsScoreboard2021,Indicator15:https://rmis.jrc.ec.europa.eu/?page=scoreboard2021#/ind/15,ISBN978-92-76-23795-2.25Bobba,S.,Mathieux,F.,Blengini,G.A.,Howwillsecond-useofbatteriesaffectstocksandflowsintheEU?AmodelfortractionLi-ionbatteries,Resources,ConservationandRecycling,Volume145.June2019,Pages279-291,https://www.sciencedirect.com/science/article/pii/S0921344919300795?via%253Dihub26COM(2022)230finalREPowerEUPlan.27COM(2020)474final,CriticalRawMaterialsResilience:ChartingaPathtowardsgreaterSecurityandSustainability.28JOIN(2021)30final,TheGlobalGateway.29COM(2022)409finalThepoweroftradepartnerships:togetherforgreenandjusteconomicgrowth.30EuropeanCommission,Directorate-GeneralforEnergy,GuevaraOpinska,L.,Gérard,F.,Hoogland,O.,etal.,StudyontheresilienceofcriticalsupplychainsforenergysecurityandcleanenergytransitionduringandaftertheCOVID-19crisis:finalreport,PublicationsOfficeoftheEuropeanUnion,2021,https://data.europa.eu/doi/10.2833/94600231COM(2020)98finalAnewCircularEconomyActionPlan.32COM(2020)474final,CriticalRawMaterialsResilience:ChartingaPathtowardsgreaterSecurityandSustainability.33MissionInnovation,InnovationPlatform,TheMaterialsforEnergy(M4E)34EuropeanCouncil,VersaillesDeclaration,https://www.consilium.europa.eu/media/54773/20220311-versailles-declaration-en.pdf,11.3.2022.13resilienceofcriticalrawmaterialssupplychinsbymeansofdiversificationofsupplythroughstrategicpartnerships;exploringstrategicstockpilingandincreasingresourceefficiencyandcircularity.CommissionPresidentvonderLeyen’sStateoftheEuropeanUnionaddressinSeptember2022includedaproposalforaEuropeanCriticalRawMaterialsAct,withtheaim“toidentifythepolicyactionsneededtodevelopstrategicprojectstostrengthenEUsupplychainswhilemaintainingasustainablelevelplayingfield35”.2.1.4CarbonPricingTheStaffWorkingDocument36accompanyingthe2021CompetitivenessProgressReportlookedatcarbonpricingappliedacrossthebiggesteconomiesthroughemissionstradingsystemsandtaxes.Sincethen,COP26inGlasgowhasagreedtherulesforcooperativeapproaches(internationalcarbonmarketandnon-marketmechanisms)undertheArticle6oftheParisAgreement.By2022,ifallplannedcarbonpricinginitiativesaroundtheglobeareimplemented,23%ofglobalgreenhousegasemissionswillbecovered,upfromlessthan15%in202037.However,lessthan4%ofglobalemissionsin2022arecoveredbyadirectcarbonpriceofaroundEUR50-100/tCO2,whichisdeemedtobetheminimumrangetomaintainglobaltemperatureincreaseto2°C38.TheEUEmissionsTradingSystem(EUETS),whichremainsthelargestcarbonmarketbytradedvalue,fallswithinthisrange,withanaveragepriceofEUR53/tCO2in2021andofEUR84/tCO2inthefirstsemesterof2022.Forcomparison,allowancesintheChineseETS,whichisthelargestcarbonmarketbyemissions39,arepricedaroundEUR5-10/tCO240,withpricesincreasingattheendof2021.IntheEU,theCommissionhasproposed41toextendtheEUETStothemaritimesector,andinparallel,tocreateaseparateupstreamemissionstradingsystemcoveringthesectorsofroadtransportandbuildings.ThenewsystemwouldprovideanadditionalsignalontopoftheEffortSharingRegulationtargets42.Withtheseproposalsenacted,emissionstradingwouldcoversome75%ofEUemissions,whichatthemomentstandsat36%43,incentivisingfurtherreductionoffossilfuelconsumption,improvementinenergyefficiency,andenergysavings.Asfuelsuppliersarelikelytopassonsomeoftheircarboncoststoconsumersbuyingtransportandheatingfuels,theCommissionhasalsopresentedaproposalforaSocialClimateFund44,whichwouldmitigatesocialanddistributionimpactsonthemostvulnerablehouseholds,micro-enterprisesandtransportusers.HighercarbonpricesandvolatilityCarbonpricesrosealsoinotherjurisdictionswhichimplementemissionstrading,suchasUK,California(WCIinitiative),NewZealand,andRepublicofKorea.IntheEU,ETSpricesrosesteadilyin2021inresponsetothemoreambitiousEUclimatepolicyandincreasinggaspricesglobally.WiththeimpactofthegeopoliticalinstabilityduetotheRussianinvasionofUkraine,priceshavedecreasedslightly,averagingataroundEUR80t/CO2inthefirstsemesterof2022.ETSrisingpriceshadpromptedquestionsfromstakeholdersaboutthepossibleroleofspeculationbehindthistrend.ThereportbytheEuropeanSecuritiesandMarketsAuthority(ESMA)45counteredtheseconcerns.Whilstthemarkethasdrawninagrowingnumberofparticipants,complianceandother,non-financialentitiesdominate,tradingmostlyinderivatives.Meanwhile,hedgefundsandfinancialinvestors,whichmightbeassociatedwithspeculativebehaviour,werefoundtobeactiveinthemarketonlytoamarginal8%extent.ETSpricescontinuetobedrivenbysupply(e.g.,graduallydecreasingcapandsupplyoffreeallowances)anddemand(e.g.,expectationsoffutureavailabilityofallowances),factorsthatareinherenttothemarketdesign.AstheEUETSbecomesmoreprominent,however,theESMAreportsuggestedwaysofreinforcingthesystemandincreasingtransparency.35https://single-market-economy.ec.europa.eu/news/commission-seeks-views-future-european-critical-raw-materials-act-2022-09-30_en36SWD(2021)307final,Progressoncompetitivenessofcleanenergytechnologies.37TheWorldBank.2022.“StateandTrendsofCarbonPricing2022”(May),WorldBank,Washington,DC.DOI:10.1596/978-1-4648-1895-0.38ValuedefinedaccordingtotheReportoftheHigh-LevelCommissiononCarbonPrices(2017).Morerecentanalysis,alsoduetotheevolutionofthegeopoliticalinstabilitypointstocarbonpricesintherangeofEUR50-250/tCO2.39Itcoverssofaronlypowersectoremissions,whichisequivalenttoover30%ofChina’stotalGHGemissions.40ICAP,2022.EmissionsTradingWorldwide:StatusReport2022.Berlin:InternationalCarbonActionPartnership.41SeeCOM(2021)551final,aspartoftherevisionofDirective2003/87/EC42COM(2021)555final43COM(2021)962final,Brussels26.10.2021.44COM(2021)568final45Esma-finalreportonemissionallowancesandassociatedderivatives(ESMA70-445-38)14Highercarbonpricesimprovepricesignalneededtoincentiviseinvestmentsinlow-carbonsolutionssuchasgreenhydrogenandCCUSfordecarbonisationofenergy-intensivesectors,suchassteel,cementandchemicals.Forthesesectors,REPowerEUproposes,inadditiontodedicatedfundingwindowsintheInnovationFund,torolloutcarboncontractsfordifferencethatwillalsosupportgreenhydrogenproductionfordecarbonisationofindustry.TheCommissionhasalsoproposedaCarbonBorderAdjustmentMechanism46toaddresstheincreasedriskofcarbonleakageinenergy-intensiveindustriesduetoEU’smoreambitiousclimatetargets.EUETSrevenuesBasedonWorldBankestimates47,forthefirsttimein2021,revenuesfromemissionstradingsystems,at67%oftotalrevenue(upfrom49%in2020),surpassedcarbontaxrevenuesglobally.IntheEUalone,ETSrevenuesreachedEUR31billion48in2021,nearlytwiceasmuchasin2020.OnaverageEUMSsspentover70%ofthisondomesticandinternationalclimate-relatedactionin2020.EUETSrevenuesarechannelledalsototheInnovationFundthatwillinvestaroundEUR38billion49incommercialdemonstrationofinnovativelow-carbontechnologiesin2020-2030.Thesecondbiggestbyrevenue,CalifornianETSsystem50,usesmostofitsrevenueonreducinggreenhousegasemissionsandpartofittowardsdirectsupportofdisadvantagedandlow-incomecommunities.Thisincreasesitsimportanceinfinancinglow-carboninnovationandgreentransition,butalsoinaddressingtheimpactsoftheenergypricecrisisandmitigatingenergypoverty.Withthis,theCommissionproposedthatMemberStatescommitallauctionrevenues(fromtheEUETSandthenewsystemforroadtransportandbuildings)toclimateandenergyprojects.2.1.5EnergypovertyEnergypovertyhasbecomeachallengerecognisedacrosstheEUasitisawidespreadconditionaffectingmillionsofhouseholdsinthecontinent.Thetermdescribestheinabilitytoaccessthesociallyandmateriallyadequatelevelofenergyservices.AcrossEUonaverageEnergypovertylevelshavebeenonadecreasingtrendsince2012withunemployed,elderly,womenandlow-incomehouseholdsbeingexposedthemosttothephenomenon.51However,themostrecentdatafrom2020(firstpandemicyear)indicatethereverseofthistrendasenergypovertystartedtoriseagain.52Assince,theincreaseontheenergypricescontinuedandinflationsoarsweexpectfurtherrisefor2021and2022onenergypovertyindexes.Buildingonrecentcommunicationsregardingenergypoverty53andrisingenergyprices54,]theEuropeanCommissionissettingupanEnergyPovertyandVulnerableConsumersCoordinationGroup[(EU)2022/589of6April]withMemberStatesandenergyregulatorstoenableanexchangebestpracticesandbetterfocusmeasurestoaddressenergypoverty–instepwithrelatedEUpoliciessuchasenergyefficiencyandtheRenovationWave.2.2Researchandinnovationtrends2.2.1PublicR&IspendingThepreviousCompetitivenessProgressreportshighlightedthat,whilepublicR&IspendingintheEnergyUnionR&Iprioritieshasbeensteadilyincreasingsince2016,itstillhasnotrecoveredtothelevelsseenbeforethefinancialcrisis.Whatismore,ithasnotbeenkeepingpacewithincreasesinGDPorincreasesinR&Iinvestmentinothersectors.For2020,mostEUMemberStatesshowanincreaseinrespectivepublicR&I,withinvestmentsofmorethanEUR4billionreportedthisfar,andfinalfiguresexpectedtobecomparablewithpre-crisisvaluesinabsoluteterms.Itisestimatedthatin2021publicbudgetsinEuropecontinuedincreasing55.Nonetheless,measuredas46COM(2021)564final47TheWorldBank.2022.“StateandTrendsofCarbonPricing2022”(May),DOI:10.1596/978-1-4648-1895-0.48EUETSaccountforaround41%oftheglobalcarbonpricingrevenueofUSD84billionin2021,accordingtotheWorldBank.AccordingtoICAPEUETSrevenuesin2021amountedtoEUR31billion.49Dependingonthecarbonprice.50The2021revenuewasapproximately10%ofEUETSrevenuebasedonInternationalCarbonActionPartnership(2022).51Koukoufikis,G.andUihlein,A.,Energypoverty,transportpovertyandlivingconditions-AnanalysisofEUdataandsocioeconomicindicators,EUR31000EN,PublicationsOfficeoftheEuropeanUnion,Luxembourg,2022,ISBN978-92-76-48396-0,doi:10.2760/198712,JRC12808452Eurostat[ILC_MDES01]Inabilitytokeephomeadequatelywarm.53RecommendationonEnergypoverty[(EU)2020/156354Tacklingrisingenergyprices:atoolboxforactionandsupport{COM(2021)66055IEA,WorldEnergyInvestment202215ashareoftheGPD,investmentinpublicR&I,atMemberStatesandEUlevel,remainsbelowthelevelsobservedpriorto2016(Figure4).Alreadyin2020,Horizon2020fundssupportingEnergyUnionR&IprioritiesaddedEUR2billiontowhatwascontributedbytheMemberStatesnationalprogrammes.ThisprovidedavitalboosttoresearchandinnovationintheEU.Whilenationalcontributionsaloneremainlowamongmajoreconomies,ifMemberStatesandHorizon2020fundsareaddedtogether,theEUrankedsecondinpublicR&Iinvestmentamongmajoreconomiesin2020(Figure5)56,bothinabsolutespending(EUR6.6billion,theUSleadswithEUR8billion);andasshareofGDP(0.046%,behindJapan0.058%andjustaheadofUSandKR57).Figure4:PublicR&IinvestmentsinEUMSasashareofGDPsincethestartofHorizon2020.Source:JRCbasedonIEA58andownwork59.Figure5:PublicandprivateR&IinvestmentsinmajoreconomiesasashareofGDPSource:JRCbasedonIEA60,MI61,ownwork62.56ThegraphoverlapsthefirsttwocategoriesofFigure4fortheEU.Thevaluesinthetwofiguresareslightlydifferent,asError!Referencesourcenotfound.includesanestimateforItaly.57ThesefiguresincludeMSandEUFrameworkProgrammefunds.Lastyear’sreportreferredtoMSfundsalone,whicharealsoshowninError!Referencesourcenotfound.andremainbelowothermajoreconomiesasashareofGDP.58Adaptedfromthe2022editionoftheIEAenergytechnologyRD&Dbudgetsdatabase.59JRCSETIShttps://setis.ec.europa.eu/publications/setis-reseach-and-innovation-data_en60Adaptedfromthe2022editionoftheIEAenergytechnologyRD&Dbudgetsdatabase.61MissionInnovationCountryHighlights,6thMIMinisterial202162JRCSETIShttps://setis.ec.europa.eu/publications/setis-reseach-and-innovation-data_en162.2.2PrivateR&IspendingAccordingtoglobalassessments,thecorporatesectorinvestsatleastthreetimesasmuchincleanenergyR&Iasgovernmentbudgets63.InvestmentbytheEUbusinesssectoraccountsfor80%oftheR&IspendinginEnergyUnionR&Ipriorities.In2019,theestimatedrespectiveprivateR&Iinvestmentwasat0.17%ofGDP(Figure5,right-handside),whichalsoamountsto11%ofthetotalR&Dspendingofthebusinessandenterprisesector.Since2014,theestimatesfortheEU,theUSandJapanshowcomparableamountsinabsolutetermsintherespectiveR&Itopics(betweenEUR18-22billionperyear).However,intermsofGDPtheEUexpenditureisabovetheUS,butlowerthanothermajorcompetingeconomies(Japan,KoreaandChina).2.2.3Research,InnovationandtheRecoveryandResiliencePlansThereformsandinvestmentsproposedbyMemberStatesintheirRecoveryandResiliencePlans(RRPs)haveexceededtheclimateexpendituretarget(atleast37%oftheRRPsexpenditure)64.Inthe2665RRPsapprovedbytheCouncilby8September2022,measuresworthEUR198billionarededicatedtotheclimatetransition,representing40%ofthetotalallocationoftheseMemberStates(grantsandloans).TheapprovedRRPsincludemeasuresrelatedtoresearchandinnovationforatotalbudgetofEUR47billion66,TheMemberStateshavethisfarallocatedEUR14.9billionintheirRRPstoR&D&Iingreenactivities.ForthemostpartpropensitytoallocatealargesharetoR&D&I,alignswiththeR&DintensityofMemberStates,indicatingasimilarweightorimportanceforthisactivityinthecontextoftheRRPasintheirusualgovernmentspending(Figure6).Themeasurestypicallyaimtoreducethefragmentationoftheresearchsystem,increasetheattractivenessofresearchcareersinpublicinstitutions,reduceadministrativeburden,supportknowledgeandtechnologytransfer,andimprovecoordinationonR&Ipoliciesbetweendifferentlevelsofgovernance67.Figure6:R&D&IingreenactivitiesintheRRPsasashare(leftaxis)andabsoluteamount(rightaxis).TheR&DintensityvsGDP(rightaxis)isalsogivenforcomparison.Source:JRCbasedonECFINdata63IEA,2020.Trackingcleanenergyinnovation-Aframeworkforusingindicatorstoinformpolicy64TheprogressontheimplementationoftheRecoveryandResiliencePlanscanbefollowedliveontheRecoveryandResilienceScoreboard,anonlineplatformsetupbytheEuropeanCommissioninDecember2021.65AT,BE,BG,CY,CZ,DE,DK,EE,EL,ES,FI,FR,HR,IE,IT,LT,LU,LV,MT,PL,PT,RO,SE,SI,SK.66ThefiguresarebasedonthepillartaggingmethodologyfortheRecoveryandResilienceScoreboardandcorrespondtothemeasuresallocatedtothepolicyareas‘R&D&Iingreenactivities’,‘digital-relatedmeasuresinR&D&I’and‘R&D&I”asprimaryorsecondarypolicyareas.Formoreinformation,theRecoveryandResilienceScoreboardisavailableat:https://ec.europa.eu/economy_finance/recovery-and-resilience-scoreboard/67EuropeanCommission.RecoveryandResilienceScoreboard,ThematicAnalysis,ResearchandInnovation,April2022172.2.4PatentingActivityHalfoftheMemberstateshaveincreasedtheirpatentingactivitysincethestartofHorizon2020,includinggreeninnovationchampionssuchasGermanyandDenmarkperformstronglybothinabsolutenumbersandintheshareofgreenpatentsintheiroverallinnovationportfolio,asindicatedinthepreviouscompetitivenessprogressreport.Thismeansthat,onaveragepatentspermillionhabitantintheEUhaveincreasedby10%inthesameperiod(Figure7),andmaintainsitsgoodpositioninginpatentsprotectedinternationally,ashighlightedinpreviousreports.Overall,itremainssecondtoJapaninhigh-valuepatentsrelevanttotheEnergyUnionR&IprioritiesbutisaclearleaderinrenewablesandsharestheleadwithJapaninEnergyEfficiencyduetotheEUspecialisationinmaterialsandtechnologiesforbuildings.TheEUalsoshowsspecialisationinrenewablefuels,batteriesande-mobilityandcarboncapture,storageandutilisationtechnologies.Thepreviouscompetitivenessreportsincludedconcernsabouttheimpactofstate-orsubsidy-backedtechnologydomination,closedmarketsanddifferentintellectualprotectionrules,andpoliciesoninnovationandcompetitivenessinthesector,especiallyasmanifestedbyChina.InlightofRussia’saggressionagainstUkraine,boththeEPO68andtheUSPTO69havedecidedtofreezeco-operationwiththepatentofficesoftheFederationofRussiaandofBelarus,aswelltheEurasianPatentOrganisation.RevisedRussianlegislation70that–ifenacted–couldprovidelocalactorswiththeabilitytouseforeignpatentswithouttheconsentofthepatentholdersandwithoutpayingroyalties,furtherunderminestheimportanceofrespectingIPrightsandwouldmakeitdifficultforforeigncompaniestoresumeoperationsinthatmarket.ToaddressIPchallenges,thereisaneedtochangetheparadigmofknowledgevalorisationandfocusonbroaderintellectualassets,beyondprotectedIP.AnewERAforResearchandInnovation71callstoupdateanddevelopGuidingPrinciplesforknowledgevalorisationandaCodeofPracticeforthesmartuseofintellectualproperty(IP).Thisdraftcodeofpractice,providingadvicetostakeholdersonchallengesrelatedtointellectualassetsinthecurrentR&Icontext,wasco-createdbyacommunityofpracticelaunchedbytheCommissionandisexpectedbytheendof202272.Figure7:PatentspermillioninhabitantsintheEnergyUnionR&IprioritiesperEUMSsincethestartofHorizon2020.Source:JRCbasedonEPOPatstat73.2.2.5ScientificPublicationsIncontrasttopreviousyears(2016-2019),in2020,therewasaslightdecreaseinscientificpublicationsaddressinglowcarbonenergytechnologiesglobally.TheEUscientificoutputalsofollowedthistrend,albeitwithamoremodestincreaseinthepreviousperiodandmorepronounceddeclinein2020comparedtotheglobalaverage.TheEUcontributedjustover16%ofthescientificarticlesworldwide,butwasovertwotimes68EPOpressrelease,StandingtogetherforpeaceinEurope,Munich,1March202269USPTOstatementonengagementwithRussia,theEurasianPatentOrganization,andBelarus,March22,202270DecreeoftheGovernmentoftheRussianFederationdated6March2022No.299“OnAmendingitem2oftheMethodologyofcalculationofcompensation’samounttobepaidtopatentownerresultedindecisiontouseinvention,utilitymodelorindustrialdesignwithoutpatentowner’sconsent,andprocedureofitspayment”71COM(2020)628final72AnewguideisalreadyavailableonthevalorisationofresultsfromHorizonEuropehttps://data.europa.eu/doi/10.2826/43764573JRCSETIShttps://setis.ec.europa.eu/publications/setis-reseach-and-innovation-data_en18abovetheglobalaverageintermsinpublicationsperpopulation74,75.Nonetheless,theEUspecialisationincleanenergyresearchhasbeendecreasingbetween2016and2020,asscientificoutputismoreintensiveinfieldssuchaspsychologyandcognitivesciences,economicsandbusiness,andclinicalmedicine,attheexpenseofe.g.informationandcommunicationtechnologies,andengineering.Thisisconsistentwiththeobservationthat,afteraninitialadvantage,high-incomeeconomiesnolongerdominatetopicsrelatedtocleanenergyandinnovation76.Nonetheless,EUscientistscollaborateandpublishinternationallywellabovetheglobalaverage,andshowahigherlevelofcollaborationbetweenthepublicandprivatesectors.Notably,fourEUfundingmechanismsareamongthetop20acknowledgedinsupportingcleanenergyscienceintheperiod2016-2020,Horizon2020,listedamongthetop1077.2.2.6CoordinatingR&IeffortsintheEUandglobalcontextLaunchedin2007,theStrategicEnergyTechnologyPlan(SETPlan)constitutedafirststeptoestablishanenergytechnologypolicyforEurope.TheoverallobjectiveoftheSETPlanistoprovideacommonvision,goalsandcoordinationinacceleratingthedevelopmentanddeploymentofefficientandcost-competitivelow-carbontechnologies,andtoenhancetheEU’sgeo-politicalresilienceandsecurityofenergysupply.Underitsumbrella,theSETPlanisgatheringexpertsfromgovernments,industry,andresearchinstitutesintheEUandAssociatedCountriestodevelopresearchandinnovationroadmapsforkeyenergytechnologies.TheSETPlanwasupdatedin2015,proposing10ActionssupportedbyanewstructurewithEuropeanTechnologyandInnovationPlatforms(ETIPs)developingStrategicResearchandInnovationAgenda’s,and14correspondingImplementationWorkingGroups(IWG)toacceleratetheenergysystemtransformation.TheSETPlanplayedacentralroleinimplementingtheResearch,Innovation&CompetitivenessdimensionoftheEnergyUnion,andinguidingnationalenergyresearchstrategies,asreflectedintheNationalEnergyandClimatePlans.Thus,theroleoftheSETPlaniscrucialincoordinatingnationalR&Iagendasonlow-carbonenergy.OneofthekeyrecentcontributionsoftheSETPlanactorstowardsEuropeancross-sectoralcooperationistheestablishmentoftheEuropeanCleanEnergyTransitionPartnership(CETP)78.EmanatingfromtheSETPlanimplementationplans,manyoftheworkinggroups(e.g.SolarPV,Wind,Geothermal,Positiveenergydistricts,Energysystems,Energyefficiencyinindustryandbuildingsandothers)havebeensuccessfullyinvolvedinthestrategicdesignofthetopicswithintheCETP,includingco-authoringinputpapersandcontributingtothedevelopmentoftheStrategicResearchandInnovationAgenda(SRIA).ThecollaborationundertheCETPisexpectedtoboostandaccelerateenergytransitioninallitsdimensions.Inaddition,itwillenablejointR&Iprogrammesfromregionaltonationalandgloballevel,co-supportedbyindustry,publicorganisations,researchandcitizens’organisationstomakeEuropeafrontrunnerinenergyinnovation.Inarapidlychangingpolicycontext,theSETPlanmustaligntheEU,nationalandindustrialresearch&innovationobjectiveswiththeEuropeanGreenDeal,Fitfor55,REPowerEU,andthenewEuropeanResearchArea(ERA)Agenda.Tothisend,bytheendof2022,theCommissionispreparinganewSETPlanCommunication.TherenewedSETPlanwillaimtotacklethefollowingpressingneeds:-increasetheperformanceandcostefficiencyofcleanenergytechnologiesaswellastheefficiencyandresilienceofcleanenergyvaluechains,includingatindustrialmanufacturinglevel;-acceleratethedevelopmentandthedeploymentofcleanenergytechnologies;-defineanoverallstrategytoexploitsynergiesbetweenR&Istrategiesandtheinnovationlandscapeatnational,Europeanandinternationallevel,andlimitedsynergiesbetweenthevariousinstrumentsforfinancialsupportforR&IatnationalandEUlevel;-paymoreattentiontocross-cuttingissues,suchasenvironmentalneeds(sustainability,circularity,bestuseofresources)andsocialneeds(health,safety,security,availabilityandaffordabilityofenergy,publicengagement);74EuropeanCommission(2022),Publicationsasameasureofinnovationperformance:Selectionandassessmentofpublicationindicators.Reportinprogressundertenderedstudy2018/RTD/g1/OP/PP-07481-2018authoredbyProvencal,S;Khayat,P.,andCampbell,D.,ScienceMetrix.75ThestudyfocusedonSETPlankeyactions:No1inRenewables,SmartSolutionsforConsumers,Smart,ResilientandSecureEnergySystem,EnergyEfficiencyinBuildings,EnergyEfficiencyinIndustry,Batteriesande-Mobility,RenewableFuelsandBioenergy,CarbonCaptureUtilisationandStorage,NuclearSafety76UNESCO(2021)UNESCOScienceReport:theRaceAgainstTimeforSmarterDevelopment.S.Schneegans,T.StrazaandJ.Lewis(eds).UNESCOPublishing:Paris.77Elsevier(2021)PathwaystoNetZero:TheImpactofCleanEnergyResearch,ElsevierAnalyticalServices78https://cetpartnership.eu/19-considerchallengestotheenergytransitionwhichhaveemergedsincethecreationoftheSETPlan,suchastheavailabilityofcriticalmaterials,digitalisation,technologydependenceandresilience,amongstothers;-addresstheincreasingroleofenablingtechnologiesorfuels,suchasenergystorage,smartgridsandhydrogen;-reinforcetheResearch,InnovationandCompetitivenesschaptersintheNationalEnergyandClimatePlans.TheCommunicationon‘EUexternalenergyengagementinachangingworld’envisagestheintensificationofinternationalcooperationandthedevelopmentofpartnershipssupportingthegreentransitiononcrucialtopics,suchasgreenhydrogenglobally,accesstorawmaterials,orinnovations.Toadvanceinternationalcooperationonenergyinnovationandtechnology,theECcontinuesitsengagementinMissionInnovation(MI)andtheCleanEnergyMinisterial.Aftersuccessfulfirstfiveyears,MI2.0waslaunchedwithanewsetof‘Missions’.TheEUco-leadstheMissionsoncleanhydrogenandurbantransition(Table2).InadditiontheECispartoftheMISecretariatandTechnicalAdvisoryGroups,whichsupportallMIMissions.Table2:EUparticipationinMissionInnovation2.0Source:JRCbasedonMI2.2.7VentureCapitalInvestmentsinClimateTechFirmsandCleanEnergyTechnologiesEUclimatetech79start-upsandscale-upshaveattractedanincreasingamountofventurecapital(VC)investment80overthelast6years.Worldwide,VCinvestmentsintheclimatetechdomain(start-upsandscale-ups)reachedEUR40.5billionin202181,anincreaseof100%comparedto2020(EUR20.2billion).In2021,EUclimatetechfirmsattractedEUR6.2billionofVCinvestments,morethanatwofoldincrease(x2.2)ascomparedto2020.TheEUcurrentlyaccountsfor15%ofglobalclimatetechinvestmentsandshowedimpressiveresilienceduringtheCovidpandemicwithhigherlevelsofinvestmentsalreadyin2020andnewall-timehighsin2021.Withanoutstandinggrowthofitslaterstagesinvestments,theEUalsoreported,forthefirsttime,ahighervalueoflaterstageinvestmentsthanChina.EarlystageinvestmentsinEUclimatetechfirmshoweverpeakedin2020,whereastheyreachednewhighsintheUSandChinain2021[Figure8].79PitchBook’sClimateTechverticalisaselectionof2760companiesthataredevelopingtechnologiesintendedtohelpmitigateoradapttotheeffectsofclimatechange.Themajorityofcompaniesinthisverticalarefocusedonmitigatingrisingemissionsthroughdecarbonisationtechnologiesandprocesses.Applicationswithinthisindustryverticalincluderenewableenergygeneration,longdurationenergystorage,theelectrificationoftransportation,agriculturalinnovations,industrialprocessimprovements,andminingtechnologies,amongothers.80Venturecapitaldealsaredefinedasearlystagedeals(includingpre-seed,accelerator/incubator,angel,seed,seriesAandBoccurringwithin5yearsofthecompany'sfoundingdate)andlaterstagedeals(usuallyseriesBtoseriesZ+roundsand/oroccurringmorethan5yearsafterthecompany'sfoundingdate,undisclosedseriesandprivateequitygrowth/expansion).81Accountingfor5.2%oftotalVCfundingin2021accordingtoJRCelaborationbasedonPitchBookdata(ascomparedto4.6%in2020).20Figure8-Venturecapitalinvestmentsinclimate-techstart-upsandscale-upsSource:JRCelaborationbasedonPitchBookdataWorldwide,theenergysectoraccountedfor22%ofVCinvestmentsinclimatetechfirmsin2021,withcleanenergygeneration82andgridtechnologies83taking13.2%and8.7%ofglobalVCinvestmentsrespectively.Thispositionstheenergysector(22%)behindtransportandmobility(46%)andforthefirsttime,aheadoffoodandlanduse(19.6%),butalsoaboveitshistoricalshare(theenergyaccountedfor16%oftheVCinvestmentsinclimatetechfirmssince2016).Investmentsinelectricvehicles(EV),EVbatterytechnologiesande-mobilityhavehistoricallybeenthemaindriversofclimatetechVCinvestments.Theshareoftransportandmobilityhoweverpeakedin2018,largelyduetoashiftawayfromcompaniesdevelopingmicro-mobilitysolutions84.IntheEUhowever,itssharecontinuedtogrowwithinvestmentsinseveralapplicationsegmentsandsomeofEU’slargestdeals85(Figure9).AsaconsequenceanddespiteincreasingVCinvestmentsintheEU,theUShas–since2016–investedahighershareintheenergysector(20.2%%)comparedtotheEU(17.3%)andChina(lessthan4.1%).IntheenergysectorglobalVCinvestmentsinclimatetechfirmssurgedin2021,amountingtoEUR8.8billionworldwide.Withlevelsmorethanthreetimeshigher(x3.8)thanin2020,investmentsincleanenergygenerationtechnologieswerethemaindriverofthisgrowth.PushedbysomelargeinvestmentsinnuclearfusionintheUSandwindinChina,theyincreasedmuchfasterthanthoseforgridtechnologies(x2.4)andclimatetechVCinvestmentsingeneral.IntheEU,VCinvestmentsinenergyfirmsalsoincreasedsignificantlyin2021(x1.6ascomparedto2020,amountingtoEUR887millionin2021),confirmingthesustainedgrowthseenoverthepast4years.Despitethisgoodperformance,theoverallEUsharehalvedin2021.With10%ofVCinvestmentsinenergyfirms,theEUranks3rdfarbehindtheUS(62%)andChina(13.3%),bothofwhichenjoyedoutstanding2021investmentlevels,drivenbymegadealsincleanenergygeneration.[Figure10]82Includingsolar,wind,nuclear,waste-to-energy,ocean&hydroandgeo-thermalenergy.83Includinglong-durationenergystorage,gridmanagement,analytics,batterytechnology,smartgridandcleanhydrogenproduction.84Lightelectricvehiclesaddressingthe“last-mile”problemintheurbantransportsector.85IncludingEVbatterytechnologies(Northvolt,Lithiumwerks),aircraft(Lilium,Volovopter),ElectricVehicles(RimacAutomobili,Einride)andmicro-mobility(TIER,Voi,VanMoof).21Figure9-ShareofVCinvestmentsinEUClimateTechfirms,byapplicationsegment.Source:JRCelaborationbasedonPitchBookdataFigure10-ShareofVCinvestmentsinEnergyClimateTechfirms,byfirmlocation.Source:JRCelaborationbasedonPitchBookdataNucleartechnologiesaccountedforhalfofthe2021globalVCinvestmentsinenergygenerationtechnologies(i.e.EUR2.8billionand7%ofglobalClimatetechVCinvestmentsin2021),correspondingtohanimpressiveten-foldincreasecomparedtoinvestmentlevelsinpreviousyears,.SeveralcompetingNorthAmericanscale-ups86haveattractedlargeinvestmentsin2021,aiminginparticularatthedevelopmentofcommercialdemonstratorsfortheproductionofnuclearfusionenergy.In2021,VCinvestmentsinidentifiedEUClimateTechfirmsdevelopingnucleartechnologiesonlyamountedtoEUR5.5million.86Thisincludesinparticulara€1.5billionmegadealinUScompanyCommonwealthFusionSystemsaswellaslargedealsinHelionEnergy(US),TAEtechnologies(US)andGeneralFusion(CA)developingsolutionsforthecommercialproductionofnuclearfusionenergy,andtoalesserextent,inNuScale(US)developingSmallNuclearReactorsolutions(fission).22Ifnucleartechnologiesareomittedfromtheanalysis,theEUaccountsfor15%ofVCinvestmentsinclimatetechfirmsintheEnergysector(cleanenergygeneration,9%andGridTech,6%),behindtheUS(47.5%)andChina(19.5%).VCinvestmentsinEUfirmsdevelopingcleanenergygenerationtechnologiesotherthannuclearcontinuedtogrowin2021(x1.3).ThemaindriverwasinvestmentsinsolarsupportedbylatestagedealsGermanyandtheNetherlands87.AlthoughtheEUwasonparwiththeUSin2020toleadonbothearlyandlatestageinvestments,in2021itranked3rd,losingmomentumwithdecreasingearlystageinvestmentsandalowerincreaseinlatestageinvestments.Earlystageinvestmentsinsolar,whichwerelargelypredominantintheEUandhigherthanintheUSin2020,decreasedin2021,bothintheEUandintheUS.TheUStooktheleadbackin2021withincreasingearlyandlaterstageinvestmentsingeothermalandwaste-to-energytechnologies.WhileVCinvestmentsinChineseenergygenerationfirmshavebeenhistoricallylowerthanintheUSandEU,amegaexpansiondealinadeveloperofwindandrelatedsmarttechnologies88putChinainaleadpositionin2021.ThisconfirmsthesuccessofChinesehigh-growthcompaniesinrapidlyattractinglargescale-upandexpansioninvestments,asrepeatedlyseeninthetransportsectoroverthepastyears.[Figure11]VCinvestmentsinEUfirmsdevelopinggridtechnologiesdoubledin2021(x2ascomparedto2020),drivenbylong-durationenergystorage(x7.8)andcleanhydrogenproduction(x5.8)withlargerlatestagedealsinGermanyandFrance89respectively.VCinvestmentsinEUfirmsdevelopingGridManagement&Analyticssolutionshoweverpeakedin2019andevenhalvedin2021.Withhigherinvestmentlevels,inparticularinbatterytechnologiesthatweresomewhatover-lookedintheEU,theUSmaintainedaleadingposition,faraheadoftheEUandChina.[Figure11]Figure11–VCinvestmentsinEnergyClimateTechfirms,bylocationandsegment(excludingnucleartechnologies)Source:JRCelaborationbasedonPitchBookdataClimateTechventuresdevelopingdigitaltechnologies90accountforasignificantshareoftheinvestmentsinenergyventuresrealisedsince2016buttoalesserextentthanintheearly2010s.Whiletheyrepresentedtwothirdofinvestmentsinenergyventuresbefore2016(bothintheEUandtheUS),digitaltechnologiesonlyaccountfor29%oftheinvestmentsrealisedintheUSsince2016butstillformorethanhalf(54%)ofinvestmentsinEUfirms.Withfluctuatinginvestmentsoverthepastyears,theUSexhibitsadifferenttrendthantheEUwhereinvestmentsindigitalventuresintheEnergysectorhavesteadilyincreased,reachinglevelsalmostcomparable87IncludingsolarinstallationcompaniesEnpal(DE)andZolaElectric(NL).88ChinesecompanyENVISIONENERGYraised€860.4millionofdevelopmentcapital(PEgrowth/expansion)inasingledealin2021.89IncludingGermancompaniesSkeletonTechnologiesandHydrogeniousLOHCTechnologies(long-durationenergystorage)andFrenchcompaniesLhyfeandEODev(cleanhydrogenproduction).90i.e.belongingtothefollowingPitchBookindustryverticals:ArtificialIntelligence&MachineLearning,BigData,Cryptocurrency/Blockchain,E-Commerce,FinTech,InternetofThings,Mobile,MobileCommerceandSaaS.23totheUS.ThecreationofnewdigitalClimateTechventuresintheenergysectorhashoweverpeakedin2015,followingtheoveralltrendofenergystart-upcreation,andtheshareofdigitalstart-upsinnewventureshasconsiderablydroppedin2018.WhiledigitalenergyinvestmentsinChineseClimateTechfirmshavebeenhistoricallylow,themega2021dealintheChinesewindsectorwillcontributetoimproveitspositioninsmartenergymanagementsoftwareandinternetofthings(IoT)inparticular.[Figure12,Figure13]Figure12-VCinvestmentsindigitalClimateTechfirmsintheEnergysector,byfirmlocationSource:JRCelaborationbasedonPitchBookdataFigure13-NumberofnewClimateTechfirmscreatedbyyearintheEnergydomainandshareofnewdigitalventuresSource:JRCelaborationbasedonPitchBookdataOverthepast3years,largerdealsintheTransportandMobilitydomainhavepermanentlyimpactedtheEUClimateTechfundinglandscape.ItdemonstratedthatwheretheEUmanagestofosterthedevelopmentofhigh-growthpotentialfirms,italsomanagestoattracttheinterestofinvestorsandincreasinglycompetitivelevelofinvestments.24Lookingatcleanenergyfirms91acrossallsectorsconfirmstheprogressachievedinreducingthefundinggapwiththeleadinginvestmenthubsthataretheUSandChina,ascomparedtothefirsthalfofthepreviousdecade.ItalsohighlightstheirbetterperformanceofEUcleanenergyfirmsinattractingearlyandlaterstageinvestments–oneofEU’smainweakness–thanEUVCfirmsingeneral.Indeed,theEUattracted:10.8%ofallrecent(2016-21)earlystageinvestmentsincleanenergyfirms,againstthe37.2%and45.6%receivedbytheUSAandChina,respectivelyandagainstthe5.3%previouslyreceivedbytheEU(2010-15).14.3%ofallrecent(2016-21)laterstageinvestmentsincleanenergyfirms,againstthe47.5%and29.2%receivedbytheUSAandChina,respectivelyandagainstthe4.1%previouslyreceivedbytheEU(2010-15).7.2%ofallrecent(2016-21)earlystageinvestmentsand8.7%ofallrecent(2016-21)laterstageinvestmentsinEUVCfirms.VCinvestmentsincleanenergyfirmshoweverremainsubjecttoverylargesingulardealsthat,whilecontributinginreducingthefundinggap,donotreflectthecoretrendsofthemajorityofdealsnorconstitutearecurringinvestmentbase.IntheEUorintheUS,VCinvestmentsremainconcentratedandonly11%ofcleanenergyfirmsaccountfor80%ofVCinvestmentsrealisedsince2016.ThesoleinvestmentsinSwedishEVBatterydeveloperNorthvolt92haveasignificantimpactontheoverallVCinvestmenttrendsinEUClimateTechfirmsoverthepastyears.Asthecompanytransitionedtowardslaterinvestmentstages,earlystageinvestmentsinEUClimateTechfirmsdecreasedin2021whilelaterstageinvestmentsincreasedtoreachforthefirsttimeahighervaluethanreportedinChina.Dismissingsuchsingulardeals93showsthattheEUmanagestomaintainthecompetitivepositionithasdevelopedinacontextofacceleratingVCinvestmentsincleanenergyfirmsworldwide[Figure14].Overthepastthreeyears,theEUrecordermoredealsofincreasinglylargersizes.Beyondspecifictechnologies94however,theirsizeandoccurrenceremainlowerthantheonesofthelargestdealsseenintheUSinparticular.In2021,earlystageinvestmentsincleanenergyfirmshavedoubled(x2.15)bothintheUSandintheEUandtheEUstandssecondwitha21.6%share.InvestmentsinEVBatterytechnologyandIndustry95aredrivingthegrowthofearlystageinvestmentsintheEUwhiletheyhavedecreasedincleanenergygeneration(inparticularsolar)andgridmanagementsolutions.In2021,laterstageinvestmentsincreasedintheEU(x1.6)butlessfasterthanintheUS(x2.3).TheEUstands3rdwith15.3%ofinvestmentsin2021.InvestmentsinSolarandLong-durationEnergyStoragearedrivingthegrowthofEUlaterstageinvestments.USinvestmentsdisplayafasterincreasethanintheEUintechnologiesrelatedtoBatteryrecyclingandfuelalternativesinparticular.91SubsetofallcompaniesselectedbyPBunderitsClimateTechverticalthatincludestechnologiesspecifictoenergygeneration(exceptNuclear),gridmanagementandenergystorage,electrictransportation,fuelalternatives,energyefficiency,industryandCCUS.Itexcludessolutionsrelatedtomobility(sharedmobility,autonomousvehicles,smartinfrastructures,andmicro-mobility),foodsystems,landuse,thebuiltenvironmentandothercarbontechs.92WithEUR3.7billionofcumulatedVCinvestmentssince2017(andanadditionalEUR1.05Billionlaterstagedealcompletedin2022),thecaseoftheSwedishEVBatterydevelopersNorthvoltconstitutesasingularsuccesswhichaccountsfor30%ofallVCinvestmentsinEUClimateTechfirmsrealisedoverthe2016-21period.ItdemonstratedthecapabilityofanEUhigh-growthenergyfirmtoleveragecorporateandgovernmentventureinvestorsandpublicdebtfinancingtorallyinstitutionalinvestorsbeyondtraditionalVCfirms(includingpensionfundsandassetmanagers)andstrategicinvestors,accesstocommercialdebtandfurtherraisetheverylargelevelsofventurefundingnecessarytoanacceleratedscale-up.93i.e.excludingthefewverylargedealswhichvalueisabovethe99thpercentileofallcleanenergydealsforeachyearandstage(earlyorlate).94e.g.solarwhereEUinvestmentsinGermaninstallationservicesproviderEnpalisthelargestsolardealrecordedin2021.95InparticularintheFrenchBatterymanufacturerVerkorandintheSwedishcompanyH2GreenSteelleveraginggreenHydrogentodecarbonizetheproductionofsteel.25Figure14-ShareofVCinvestmentsincleanenergyfirms91,byfirmlocationandstageofinvestments,excludinglargesingulardeals93.Source:JRCelaborationbasedonPitchBookdataAcloserlookatfirmsdevelopingandmanufacturingCETOtechnologiesprovidesfurtherinsightsonthecurrentsituationandchallengesfacedbythedifferentecosystems.COMPETITIVEVCECOSYSTEMS1.SOLAR:WorldwideinvestmentsinsolarPVsolutiondevelopersincreasedsharplyin2021,surpassingthehighestlevelsseenintheearly2010s.WithanactivelyfundedbaseofVCcompanies,theEUhassignificantlystrengtheneditscompetitivepositionascomparedtothe2010-15periodandaccountsfor16%ofinvestmentsrealisedsince2016(bothearlyandlate).DespiteacontinuousgrowthofinvestmentsinEUfirms,EU’ssharepeakedin2020withtheacceleration(innumberandaveragedealsize)oflaterstageinvestmentsinChinaandtheUSthathostastrongerbaseofVCcompanies.EarlystageinvestmentsintheEUpeakedin2020andremainsupportedbylowergrantfundinglevelsthanintherestoftheworld.STRONGVCCOMPANYBASEBUTLOWINVESTMENTLEVELS2.HEATPUMPS:Globalinvestmentsinheatpumpsolutiondevelopershavesteadilyincreasedsince2016toanall-timehighin2021.TheEUhostshalfoftheidentifiedVCcompaniesandhasrepeatedlysucceededinattractinghigherlevelsoflaterstageinvestmentsasof2015andholdsacompetitivepositionwith43%oflaterstagesinvestmentsoverthecurrent2016-21period.Withapeakin2017anddecreasinginvestmentssince,thispositionishoweverchallengedbythreeUSfirms96thatattractedmuchlargerdeals(bothearlyandlatestage)overthepasttwoyearsandaccountfor60%ofinvestmentsseensince2016.Asaresultandduetoalreadylowlevelofinvestments,theEUonlyaccountsfor10%ofearlystagesinvestmentsrealisedsince2016.3.BIOMASS:Afterasoftpatchfrom2016to18,globalVCinvestmentsinbioenergyventuresarebackonagrowthpath.TheEUaccountsforasignificantshare(42%)ofactiveVCcompaniesoverthecurrent2016-21periodandtogether,FranceandSwedenalonechallengetheUSleadership(22%).TheEUhasattracted24%earlystageinvestmentsand23%oflaterstagesinvestmentsoverthecurrentperiod,strengtheningitscompetitiveposition.EarlystagesinvestmentsintheEUhoweverremainedsignificantlydependentongrantsandwithaverylimitednumberofnewVCcompaniessince2016,arealmostnullin2020and2021.Laterstageinvestmentlevels,intheEUorelsewhere,howeverremainlowascomparedtoothertechnologies.4.OCEAN:With43%ofidentifiedVCcompanies,theEUhasastrongthoughageingcompanybasetodevelopaleadership.Overthecurrent2016-21period,theEUhoweveronlyaccountsfor22%ofearlystageinvestmentsduetohigherlevelsofinvestmentsintheUSandtheUKandaverylimitednumberofnewVCcompaniesoverthatperiod.WhiletheEUaccountsforalargeshareoflatestage(51%)investments96UScompaniesDandelionEnergy,StoneMountainTechnologiesandThermolift.26realisedsince2016,almosthalfofthoseinvestmentshavebeenrealisedinasingledealbackin2016.TheessentialofgrowthandexpansioninvestmentsisrealisedinmorerecentdealsintheUSandtheUK(resp.accountingfor24%and18%oflaterstagesinvestmentsoverthecurrentperiod).TheremaininginvestmentsrealisedintheEUarescatteredinsmallersizeddealsacrossseveralcompaniesthatmaybeinsufficienttoensureacompetitivescale-upofEUcompanies.5.WIND:Drivenbyamegaexpansiondealandhigherlevelsofinvestmentsinthescalingupofitsonshorewindfirms,Chinaistakingastrongleadinthecompetitiveinvestmentrace.DespiteestablishedbasesofVCcompanies,investmentsintheUSandtheEUhavedecreasedascomparedtotheprevious2010-15period.Areboundofinvestmentsinearlyonshoreventures(howevermostlyrelyingongrants)enablestheEUtoharness21%ofinvestmentsrealisedsince2016andtoincreaseitscompetitiveposition.DiscardingtheChinesemegaexpansiondealseenin2021,theEUmaintainsitscompetitiveposition14%oflatestageinvestmentsinonshorewind.TheaccelerationoflaterstageinvestmentsinoffshorewindfirmsintheUKandtheUShoweverreducesEU’sshareto16.5%andsignificantlyweakensitscompetitivepositioninOffshorewind.EMERGINGVCECOSYSTEMS(STILL)ATRISK6.CCUS:Whileglobalinvestmentshavemorethandoubledin2021andreachedall-timehighs,theEUonlyaccountsforaverylowshareofearlyandlatestageinvestments(resp.2%and4%).ThenumberofidentifiedVCcompanieslocatedintheEUisverylimitedandmostofthemhavebeencreatedduringthe2016-21period.Fivenon-EUcompaniesattractedtheessentialofVCinvestmentssince2010andbenefitedfromthesupportofEUcorporateVCsacrossdifferentpotentialapplicationsectors.7.HYDROGEN:Worldwideinvestmentsincleanhydrogenproductionfirmsmorethandoubled(x2.3)in2021.Withgrowinginvestmentlevels,theEUhasharnessed43%oflatestageinvestmentsrealisedsince2016andsignificantlyimproveditscompetitivepositionascomparedtothe2010-15period.TheEUhoweverfacesariskofbeingoutpacedaslaterstagesinvestmentsintherestoftheworldhavequadrupledin2021alone(amountingtoasmuchasallEUlaterstagesinvestmentsrealisedsince2016).Alargeshare(40%)ofidentifiedEUVCcompanieshasalsobeenfoundedduringthe2016-21periodandinvestmentsinearlyventures(whichrelyessentiallyongrants)haveincreasedmuchfasterintheUSthanintheEU.Asaconsequence,theEUonlyaccountsfor19%oftheearlystageinvestmentsrealisedsince2016.8.BATTERY:Worldwideinvestmentsinbatterytechnologydevelopersskyrocketedin2021(amountingtomorethanallinvestmentsrealisedsince2010).Bothearlystageandlaterstagesinvestmentsreachedalltime-highsin2021,supportedbyafewmegadealsinEVbatterymanufacturersinSwedenandChina97.Ascomparedtothe2010-15period,theEUhassignificantlystrengtheneditscompetitivepositionandrespectivelyaccountsfor17%and27%ofearlyandlatestageinvestmentsrealisedsince2016.Almosthalf(46%)ofidentifiedEUVCcompanieshavehoweverbeenfoundedduringthe2016-21periodandtheshareofVCcompanieslocatedintheEUremainssignificantlylowerthanintheUSandChina.Moreover,whilemostofEUfirmshaveattractedfundingoverthecurrentperiod,investmentsareveryconcentratedintheEUandaverylimitednumberoffirmshasattractedalmostalloftheinvestmentsrealisedintheEU.WhileinvestmentsinUSEVbatterymanufacturersarelowerin2021,ascomparedtoChinaortheEU,theUSistakinganundisputableleadinGridapplicationsandrecyclingtechnologies.VCECOSYSTEMSUNFITTOHARNESSINVESTMENTS9.BIOFUELS:In2021,worldwideinvestmentsinbiofuelfirmsaredroppingtowardsalltimelowsince2010.Only38%ofallidentifiedVCcompanieshasactuallyreceivedfundingovertheperiodandinvestmentsrealisedsince2016arelowerthanthoserealisedovertheprevious2010-15period.Withaweakbaseofventurecapitalcompanies(nonewventurecreation)andwithsmallerdealsthanoverthepastperiod,theEUonlyaccountsfor7%ofearlystageinvestmentsand4%oflaterstagesinvestmentsovertheperiod.AfewchampionslocatedintheUSandCAharnesstheessentialofearlystageinvestments(mostlyintheformofgrants)andofthelaterstageinvestmentsvialargedeals.10.CSP&H:ThenumberofidentifiedVCcompanies,inparticularintheEU,isverylimitedandthecurrentinvestmentlevelsseenworldwidearemuchlowerthaninthebeginningofthepreviousdecade.Followingalongperiodoflowactivity,recentdealsconfirmarenewedinterestbutremainconcentratedinafew97IncludinginSwedishcompanyNorthvolt(€2.6billion,laterstageVC)andChinese(Svolt,€2.6billion,earlystageVCandChinaaviationLithiumBattery,€1.5billion,PEgrowth)27companies(mostlyUSbased).TheEUonlyattracted7%and8%ofearly(mostlygrant)andlaterstageinvestmentsrespectively,tothebenefitofasinglecompany.11.HYDROPOWER:ThenumberofidentifiedVCcompanies,intheEUortheUS,isverylimitedandtheEUhasnotseenthecreationofanynewventureseen2016.Whileglobalinvestmentsrealisedsince2016haveincreasedascomparedtothepreviousperiod,theyremainamongthelowestascomparedtoothertechnologiesand2021displaysasharpdrop(bothearlyandlatestage).TheEUholdsacompetitivepositionwith28%ofearlystageinvestmentsoverthe2016-21periodanddespitetheabsenceofreportedgrants(whiletheyconstitutetheessentialofearlystageinvestmentsintherestoftheworld).TheleveloflaterstagesinvestmentsintheEUovertheperiodisverylow(9%)andevennulloverthreeofsixlastyears.Laterstagesinvestmentsintherestoftheworldconstitutetheessential(85%)ofallVCinvestmentsandaremostlyconcentratedinthelast4yearsandinUnitedStates.2.3HumanCapitalandSkills2.3.1EmploymentincleanenergyEUtotalemploymentinrenewableenergysectortotalled1.3millionin202098.Overall,since2015,EUtotalemploymentintherenewableenergysectorhasremainedatabout1.3million.Themainchangehasoccurredinthecompositionofjobs.In2020,heatpumpsovertooksolidbiofuels99andwindenergy,asthebiggestemployer,accountingfor24%ofalljobsinrenewables.Solidbiofuelsandwindeachcontributeaboutonefifthofthetotaljobs.Thebiggestgrowthofjobsfrom2019to2020(atover25%100,101),wasseeninheatpumpsandwindenergysector1.Theotherrenewablesremainedstableorslightlydeclined.Favourablepolicyandmarketconditionshaveledtoboomingsalesofheatpumps102especiallyinPoland,Denmark,Hungary,GermanyandtheNetherlands103,andthepositivejobcreationdevelopmentislikelytocontinuewithREPowerEUplanstoacceleratedecarbonisationofbuildings,andnewproductofferingsbecomingavailablefortherenovationsector104.SincethepreviouseditionoftheCompetitivenessProgressReport(2021),windenergysectoremploymentstartedtogrowagain,thankstocapacityadditionsintheNetherlands,Portugal,PolandandBelgium1in2020.Growthisexpectedtocontinueto2021,whichsawevengreatercapacityadditions105.Overall,solarPVsectorhashadapositivedevelopmentandjobshavemorethandoubledsince2015.Despitesupplychaindifficulties106in2021,solarPVemploymentisforeseentocontinuetogrow.Eurostat107data,whichlooksatbroadercleanenergysector108,supportstheviewthatdecliningemploymenttrendintherenewableenergysectorseenupto2018hasbeenreversed,andstoodat1.8millionin2019(thelatestavailableyear).Employmentinrenewablesgrewby11%andemploymentinenergyefficiencyandmanagementby7%from2018to2019,outpacingtheoveralleconomythatgrewonlyby1%inthesametimeframe109.98EurObserv’ER,2022.ThestateoftherenewableenergiesinEurope–Edition202120thEurObserv’ERReport.99Methodologicalrevisionshaveaffectedespeciallybiofueldata,whichisupdatedbasedonprojectdatafromtheHorizon2020projectADVANCEFUEL.100EurObserv’ERmethodologyisbasedoninvestmentexpenditures(‘followthemoneyapproach’)withouttakingfullyintoaccountthetimespanoftheemploymenteffect.Thisresultsinswingsbetweenyears,whichdoesnotnecessarilyreflectthereality.Therefore,changesbetweenyearsareonlyindicativeastheyaresusceptibletoinvestmentexpendituresthoseyears.101Allotherrenewableenergysectorsexperiencedsomecontractionin2020comparedto2019.Duetosomeupdatestothemethodology,employmentfiguresfor2019werecorrecteddownwards.102Thisreferstoheatpumpsusedforheatingmainly.103EurObserv’ER2022.Heatpumpbarometer2021104EHPA.2022.EuropeanHeatPumpMarketandStatisticsReport2021.105EurObserv’ER2022.Windenergybarometer2022;EurObserv’ER2021.Windenergybarometer2021.106EurObserv’ER2022.SolarPVbarometer2022.107Employmentintheenvironmentalgoodsandservicessector[env_ac_egss1]108CleanenergysectorfiguresinthereportrefertodatabasedonEurostatEGSSthefollowingcategories’CREMA13A’,’CREMA13B‘and’CEPA1’.’CREMA13A’includesProductionofenergyfromrenewableresourcesincludingalsomanufacturingoftechnologiesneededtoproducerenewableenergy.CReMA13B-Heat/energysavingandmanagementincludesheatpumps,smartmeters,energeticrefurbishmentactivities,insulationmaterials,andpartsofsmartgrids.CEPA1–Protectionofambientairandclimate–includeselectricandhybridcars,busesandothercleanerandmoreefficientvehiclesandcharginginfrastructurethatisessentialfortheoperationofelectricvehicles.Thisincludesalsocomponents,suchasbatteries,fuelcellsandelectricpowertrainsessentialforelectricvehicles.109Eurostat[lfsi_emp_a].28EUMemberStatespositiondifferentlyinthecleanenergyvaluechain110.InDenmark,Croatia,Latvia,Austria,Portugal,Finland,Belgium,Czechia,GermanyandEstoniaover40%ofrenewableenergyjobswereinthemanufacturingaccordingtothelatestavailabledata.Forexample,exportsalesconstituteanimportantsourceofwindjobsinmanufacturingcountriessuchasGermany,SpainandDenmark111.While,incountrieslike,Poland,Romania,Slovenia,Sweden,andLithuania,majorityofjobs(over40%)wereintherenewableenergygeneration,inotherwordsoperation,maintenance,etc.InFrance,40%ofjobswereintheconstruction,inotherwordsinstallationstage,andanother40%wasingeneration.InSpain,jobsweremoreevenlyspreadalongthevaluechain,andasignificantsharecamealsofromscientificandtechnicalactivities.GlobalcomparisonGloballyrenewableenergyemploymentreached12million112in2020,withthebiggestshareofjobsinChina(39%)followedbytheEU(11%)113.SolarPVindustry(33%),with4millionworkers,remainsthebiggestrenewableenergyemployerglobally,followedbybioenergy(29%),hydropower(18%)andwindenergy(10%).Overallrenewablesshowedtheirresilienceduringthepandemicwithactivitysurgingalreadytowardstheendof2020andturningtoglobalskillsgapsandshortages.Especiallytechnicalskillsareingrowingdemandacrosstheenergyindustrypushingcompaniestowardsautomationanddigitalisation,whichisalreadyseeninfallingjobintensityinmaturetechnologiessuchassolarPVandwind114.Ontheotherhand,renewableenergyjobsaregainingtractionwithintheenergyindustry(e.g.fromoil&gassectorwhichhasmanytransferrableskills),whileontheotherhandindustryconvergenceandaccelerateddigitalisationexacerbateglobalcompetitionfortalentacrossindustries115.Withinthealreadyinternationallymobileenergylabourforce,Europewasthepreferreddestinationforrelocationespeciallywithinrenewables,howeverthisrequiresensuringcareerdevelopmentandprogressionopportunities116.RecoveryfromthepandemicRecoveryfromthepandemichasbeenaccompaniedbysupplychaindisruptionsandemploymentshortagesspillingoverfromoveralleconomytocleanenergysectors.ManufacturingindustryintheEUfeltincreasinglabourandmaterialshortagesthroughoutthe2021somewhatstabilisinginthefirsthalfof2022.Nearly30%ofbusinessesinmanufactureofelectricalequipment117experiencedshortagesoflabourstillin2022,whichisathigherlevelthanthepreviouspeakseenin2018.Thistrendismainlyduetotheoveralleconomicrecoveryfromthepandemiccombinedwiththecleanenergysectorinertiainbuildingtheskillscapacitiesrequiredbythegreenanddigitaltransition118.ThelackofadequatelyskilledworkforcehasbeenhighlightedbytheCleanEnergyIndustrialForum(CEIF),whichcommitstosteppingupeffortsandinvestmentsinthedevelopmentofskills,strengtheningreskillingandupskillingprogrammes.Asanillustration,CEIFestimatesforreskillingandupskillingneedsare:800,000peopleinbatteriesvaluechain,250,000peopleinoffshorerenewableenergy,130,000inthesolarheatingandcooling,and400,000peopleinheatpumpvaluechain119.110ThisissubjecttoMemberStatereportingalongNACEactivitiesintheEnvironmentalGoodsandServicessectoraccounts[env_ac_egss1].111IRENAandILO.2021.RenewableEnergyandJobs–AnnualReview2021.InternationalRenewableEnergyAgency,InternationalLabourOrganization,AbuDhabi,Geneva.112Includesdirectandindirectemployment.113AccordingtoIRENAandILO.2021.RenewableEnergyandJobs–AnnualReview2021.InternationalRenewableEnergyAgency,InternationalLabourOrganization,AbuDhabi,Geneva.114IRENAandILO.2021.RenewableEnergyandJobs–AnnualReview2021.InternationalRenewableEnergyAgency,InternationalLabourOrganization,AbuDhabi,Geneva.115TheGlobalEnergyTalentIndexReport.2022.Airswift,EnergyJobline,London.116TheGlobalEnergyTalentIndexReport.2022.Airswift,EnergyJobline,London.117‘NACE27:Manufactureofelectricalequipment’usedasaproxyforrenewableenergymanufacturingindustryasmanyrenewableenergytechnologiesfallunderthiscategory.ItisalsousedasaproxyforrenewablesindustrialecosystemintheEUIndustrialStrategy[COM(2020)108finalanditsrecentupdateCOM(2021)350final].118Theinertiaisduetovariousjobmisalignments,suchasspatial,sectoral,occupationalandtemporalcoupledwiththefast-pacedchangetowardsgreenanddigitalwhileittakestimetobuildtheskillscapacity.Thisisbasedon,e.g.Czako.2022.JRC129676(forthcoming);Asikainen,T.,Bitat,A.,Bol,E.,Czako,V.,Marmier,A.,Muench,S.,Murauskaite-Bull,I.,Scapolo,F.andStoermer,E.,Thefutureofjobsisgreen,EUR30867EN,PublicationsOfficeoftheEuropeanUnion,Luxembourg,2021,ISBN978-92-76-42571-7,doi:10.2760/218792,JRC126047;andCedefop(2022).Anallyinthegreentransition.Cedefopbriefingnote,March2022.http://data.europa.eu/doi/10.2801/712651119CleanEnergyIndustrialForum.JointDeclarationonSkillsintheCleanEnergySector,published16June2022.Availableat:https://ec.europa.eu/info/news/clean-energy-industrial-forum-underlines-importance-deploying-renewables-2022-jun-16_en29ComparedtolabourshortagesintheEUmanufacturing,materialandequipmentshortageisevenmoreseverereachingall-timehighlevelin2022.Over70%ofbusinessesinthemanufactureofelectricalequipment120facedmaterialshortages,whichissignificantlyhigherthanintheoverallmanufacturingindustryat53%.Figure15:LabourandmaterialshortagesexperiencedbyEUbusinessesinmanufactureofelectricalequipmentandtotalmanufacturingindustry[%]Source:JRCbasedonBusinessSurveydatafromDGECFIN2.3.2SkillsandtrainingneedsSufficientworkforcewithrelevantskillsets,attherightlocationsisanimportantenablerofasuccessfulgreen-digitaltwintransition121.AvailabilityofskilledworkforceisalsoapreconditionofthesuccessfulimplementationoftheEUGreenDealandtheREPowerEUPlan.Independentofsectororoccupation,asetoffoundational(cognitive,interpersonal,self-leadershipanddigital)skillsisbeneficialforcitizensinthelabourmarketingeneral.Inaddition,sustainabilitycompetencesarenecessarytoperformsustainability-relatedjobsandtoperformotherjobsinasustainablemanner.Therefore,sustainabilityneedstobeembeddedinalleducationandtrainingprogrammes,enablingeffectivebehaviourchangethroughattitudesandvaluesystems.Specialistsinusingtransformativetechnologies(e.g.dataanalysis,machinelearning,roboticsdesign)arescarceandwillbeneededacrossabroadrangeofindustries.Greenskillsmostrelevantinthetransitionoftheeconomyasawholeincludehardtechnical,engineeringandscientificskillsontheonehandandmanagerialskillsontheother.TheEUistakingactiontoanswerskillsrelatedchallengesposedbythedigital-greentwintransitionthroughitsoverarchingskillspolicyframeworkrepresentedbytheEuropeanSkillsAgenda.Otherrelatedactionsincludetheworkofspecialisedbodies(e.g.CEDEFOPandEIT),reskillingbeingakeypillaroftheJustTransitionMechanism,addressingskillsneedsinpolicyguidanceissuedonensuringafairtransitiontowardsclimateneutrality,andrecommendationsonindividuallearningaccounts,micro-credentialsandlearningforenvironmentalsustainability.Fundingisavailabletosupportformalandnon-formaleducationandtrainingrelatedtothegreentransition(e.g.underErasmus+,EuropeanSocialFundPlus,RecoveryandResilienceFacility,HorizonEurope).Skillsrequiredincleanenergyindustriesareobtainablethroughformalandnon-formaleducationpathways(vocationaleducationandtrainingincludingapprenticeships,highereducation,on-the-jobtraining,aswellasspecializedtrainingprogrammes).Non-conventionaltrainingprogrammes,includingcertificationschemesandcompanyandindustrialecosystemcertifiedprogrammesoftenofferafasterresponsetolabourmarketneedsthansolutionsthroughformaltrainingsystems.Inoffshorewind,specializedcertificates,specialisedapprenticeshipsandhands-onexperienceplayanincreasinglysignificantroleacrossjobrolesandeducationlevels.Inthebuildingssector,on-sitetrainingofworkerswithpracticalexercisesanddemonstrations,developmentoftrainingandcertificationprogrammes,e-learningplatforms,competencedatabases,knowledge120‘NACE27:Manufactureofelectricalequipment’usedasaproxyforrenewableenergymanufacturingindustryasmanyrenewableenergytechnologiesfallunderthiscategory.ItisalsousedasaproxyforrenewablesindustrialecosystemintheEUIndustrialStrategy[COM(2020)108finalanditsrecentupdateCOM(2021)350final].121Czako.2022.JRC129676.30centres,skillsregisters,skillsadvisorapps,provisionoffreeandeasilyaccessibletrainingmaterials,fundingoftrainingfacilities,aswellastrain-the-trainerschemeshavebeenappliedtoeaseskillsdemand.2.3.3GenderbalanceEqualgenderparticipationcanhelpsocietyleaptoafutureoftechnologicaladvancementintheenergysector.Toensurethetransitiontoenergysecurityandclimate-neutrality,thegendergapmustbeclosedandwomenfullyinvolvedinatechnical,scientificandbusinesstransformation.PromotinggenderequalityinresearchandinnovationispartoftheGenderEqualityStrategyfor2020-2025122,whichsetsoutthebroadercommitmenttoequalityacrossallEUpolicies.RecentinvestigationsbytheEuropeanPatentOffice(EPO)showthatforapplicationsfiledin2021,withatleastoneinventorbasedinEurope,roughly20-21%namedoneormorewomenasinventors123.Inthepatentclassescloselyassociatedtotheenergysector–combustionapparatus,engines,pumpsandpower–womenarelistedinlessthan11%ofapplications,andover15%forclimatechangemitigationtechnologies(CCMT),whichiscomparabletoalltechnologies,includinginformationandcommunicationtechnologies(ICT).124Also,lessthan15%ofstart-upsarefoundedorco-foundedbywomen(andonly6%bywomen-onlyteams).125Thistranslatesintolowamountsofcapitalinvestedintowomen-ledcompanies,creatingaviciouscircle.In2021,all-femalestart-upssecuredonly2%ofallavailableventurecapital,comparedto3%in2020.Mixedteams,ledbybothmenandwomen,sawasmalljumpinfunding,from8%to9%,butdownfrom11%in2019.126Moreover,womenareunderrepresentedinhighereducationinScience,Technology,Engineering,andMathematics(STEM)sub-fieldsthatarehighlyrelevantfortheenergysectorandthatremainheavilymaledominated.Sincein2019lessthanathirdofengineering,manufacturing,andconstructionandlessthanafifthofICThighereducationstudentswerefemale.127Womenalsoparticipatelessindecision-makinginenergycompanies.TheIEAanalysed2,500energyandutilityfirms(38,000employees),findingthatapproximately14%ofseniormanagementarewomen128.Thisisonlyslightlylowerthanthe15.5%observedintheover30,000non-energyfirmssampled.Somewhatsurprisingly,renewableenergyfirmsarewellbelowthecompositeaverageatjust10.8%.Thereareincreasinglymoreinitiativesstimulatingwomen’sinvolvementininnovation.Thenumberofwomen-ledstart-upsreceivingfundingfromtheEuropeanInnovationCouncil(EIC)hasgrownfrom8%inthefirsthalfof2020to29%insecondhalfof2020.129AshareofthesefundswenttostartupsdevelopingtechnologiesthatwillcontributetotheEU'stargetofreducingnetgreenhousegasemissionsbyatleast55%by2030,whichisalsothekeycriteriaintheEIC’s2022workprogramme.InJune2022,theEUlaunchedsecondeditionofWomenTechEUthatprovidessupportforupto130deep-techstart-upsledbywomenattheearliest,riskieststageoftheircompany’sgrowth.130HorizonEuropealsohasaneweligibilitycriterionwhereresearchorganisationsapplyingforfundingmusthaveanactionableGenderEqualityPlan,withatargetforagenderbalanceof50%inallHorizonEuroperelateddecision-makingbodiesandevaluators.2.3.4Impactonconventional/fossilfuelenergyemploymentDeploymentofcleanenergytechnologiescanhaveanimpactonconventionalenergysectoremploymentbuttheexactimpactdependsontheregion,compositionoftheconventionalenergysectorandthetypeofrenewabledeployed.AsalreadypreviouseditionofCompetitivenessProgressReport2021131described,countrieswithcoalminingactivitiesarethemostsensitivetotheinfluenceofrenewablesdevelopment132.AccordingtoEurObserv’ERindicativeestimate,thebiggestsubstitutioneffecttookplaceinGermany,Romania,Spain,Poland,ItalyandFrance.Nevertheless,allofthesecountries,aswellasallEUcountriesingeneral,with122EuropeanCommission,Genderequalitystrategy123EuropeanPatentOffice2022.124InternationalEnergyAgency,2020125EuropeanInnovationCouncilandSMEsExecutiveAgency(EISMEA),2022126IDCEuropeanWomeninVentureCapitalreport2022127JRCbasedonEurostat[EDUC_UOE_ENRT03]128InternationalEnergyAgency,2021129Euraxess2022130EuropeanInnovationCouncilandSMEsExecutiveAgency(EISMEA),2022131COM(2021)952final.132AlvesDias,etal.,RecenttrendsinEUcoal,peatandoilshaleregions,EUR30618EN,PublicationsOfficeoftheEuropeanUnion,Luxembourg,2021,ISBN978-92-76-30987-1,doi:10.2760/510714,JRC123508.31theexceptionofRomania,gained2-6timesmorejobsthanthenumberofdisplacedfossilenergyjobs133.Inordertofullytapintothecleanenergyjobcreationpotentialintheregionsmostaffectedbythetransition,variousjobmisalignments,suchasspatial,sectoral,occupationalandtemporal,needtobeactivelymonitoredinordertoanticipateskillsneedsandtosetupappropriateframeworksandmechanismforup-skillingandre-skilling134.Also,themostaffectedregionswouldbenefitfrominvestmentsineconomicdiversification,forinstance,ifmaterialinfrastructureinvestmentswentbeyondenvironmentalrestorationandrenewableandalternativeenergywithinvestmentsinsupportsectorssuchaseco-tourismorsustainablefarming135.2.4GrossValueAddedincleanenergyEconomicdataonthecleanenergysectorisavailablefromtheEurostatenvironmentalgoodsandservicesaccountsandmorespecificallyforrenewablesfromEurObserv’ER.RenewableenergyturnoverintheEUgrewby9%since2019andstoodatEUR163billionin2020136.Heatpumpsandwindenergywereexclusivelyresponsibleforthehigherturnover,with36%and27%growthfrom2019to2020.Turnoverintherestoftherenewablesremainedstableorcontractedinthesametimeperiod.Windenergyandheatpumpsgeneratedalsothebiggestsharesofthetotalturnover,at27%and25%respectively.Duringthesameperiod(2019-2020),grossvalueaddedintheEUrenewableenergysectorgrewby8%andstoodatEUR70billion137.EurostatdatacollectedfromMemberStatesonenvironmentalgoodsandservices138isveryclosetoEurObserv’ERvaluesfortherenewables.GrossvalueaddedisslightlyloweratEUR66billionin2019,whereasoutputisslightlyhigheratEUR187billionin2019.Eurostatdatafor2020isnotyetavailable.Thedifferenceisassociatedtodifferentmethodologies.EnergyefficiencyandmanagementactivitiesgeneratedanotherEUR188billioninturnover,outofwhichEUR73billionwasgrossvalueaddedin2019.E-mobilitysectorgeneratedEUR15billioninturnover,outofwhichEUR6billionwasgrossvalueaddedin2019.Incomparison,fossilfuelindustrycontinuedtohaveadecliningtrendingeneratedturnover(EUR530billionin2020139)andgrossvalueaddedasreportedalreadyinthepreviousreports.Theonlyexceptionismanufactureofcokeandrefinedpetroleumproducts,inwhichturnoverhasdeclinedbutvalueaddedhasnearlydoubledin2011-2020140,indicatingimprovingproductivity.Every1EURofturnoverintherenewableenergytechnologiesgeneratedapproximately0.43EURofgrossvalueadded141.Whereasturnovergrewby9%from2019to2020,grossvalueaddedgrewonlyby8%,whichresultsinaslightlyworseninggrossvalueaddedtoturnoverratio.Whilethisisonlyaslightworsening,itindicatesthatthereisagrowingleakageforexampleintheformofimports.Overall,cleanenergyindustrygeneratesabout4timesmorevalueaddedfrom1EURofturnover142,whichimpliesthatitcreatesmorevalueaddedcomparedtofossilindustry.Moreover,cleanenergyindustryhasnearly70%highergrossvalueaddedtoturnoverratiothantheoverallmanufacturingindustryintheEU143.2.4.1LabourproductivityOveralllabourproductivity144inthecleanenergysectorisabout20%higherthanonaverageintheoveralleconomy145.Itisimprovingslightlyfasterat2.5%annuallysince2015,comparedto1.8%averageannualincreaseintheoveralleconomy.Inrenewableenergysectorande-mobilitylabourproductivityincreasesevenfasterat4%and5%respectivelysince2015.Whilst,inenergyefficiencyandmanagementactivities,labourproductivityisgrowingonlyat2%annuallysince2015.Thesituationisdifferentdependingonthecleanenergy133EurObserv’ER.2022.TheStateofRenewableEnergiesinEurope.Edition2021–20thEurObserv’ERReport.134Asikainen,T.,Bitat,A.,Bol,E.,Czako,V.,Marmier,A.,Muench,S.,Murauskaite-Bull,I.,Scapolo,F.andStoermer,E.,Thefutureofjobsisgreen,EUR30867EN,PublicationsOfficeoftheEuropeanUnion,Luxembourg,2021,ISBN978-92-76-42571-7,doi:10.2760/218792,JRC126047.135ibid136EurObserv’ER.2022.TheStateofRenewableEnergiesinEurope.Edition2021–20thEurObserv’ERReport.137EurObserv’ER.2022.TheStateofRenewableEnergiesinEurope.Edition2021–20thEurObserv’ERReport.138Eurostat[env_ac_egss2].139ForcomparisonturnoverwasaboutEUR1trillionin2012.140ValueaddedhasincreasedfromEUR18billiontoEUR33billionin2011-2019.141Thisvariesamongcleanenergytechnologies.BasedonEurostatthisisslightlyloweratEUR0.35duetomethodologicaldifferences.142GrossvalueaddedtoturnoverratioofthefossilindustryislessthanEUR0.10.143BasedonEurostat[SBS_NA_IND_R2]data,grossvalueaddedtoturnoverratioofmanufacturing(NACEC)intheEUisaboutEUR0.25.144Asgrossvalueaddedperemployee.145ThisisbasedonEurostatdataongrossvalueadded[env_ac_egss2]andemployment[env_ac_egss1].32technology.Inheatpumps,labourproductivitygrewby8%in2019-2020,whileinwindsector,whichhasthesecondhighestlabourproductivityamongtherenewableenergytechnologies,itdecreasedby2%inthesameperiod146.Geothermalhasthehighestlabourproductivityamongtherenewableenergytechnologiesanditimprovedby3%in2019-2020.2.5SocialaspectsandcitizenengagementFromcitizens’acceptancetocapacitybuilding-energycommunitiesandinstitutional‘nudging’The2019SpecialEurobarometer492147,onEuropeans’attitudesonEUenergypolicyindicatesaclearattitudeofsupporttowardsthecleanenergytransitionbytheEU’scitizens.The2021SpecialEurobarometer513148onClimateChangerevealsthatEuropeancitizensconsiderclimatechangeisthesinglemostseriousproblemfacingtheworld.Intermsofpolicyresponse,Europeans(90%)agreethatgreenhousegasemissionsshouldbereducedtoaminimumandmaketheEUclimate-neutralby2050.ClosetonineintenEuropeans(87%)thinkitisimportantthattheEUsetsambitioustargetstoincreaserenewableenergyuse,andthatitisimportantthattheEUprovidessupportforimprovingenergyefficiency149.TheabovemakequiteclearthattheacceptanceofthetransitionisnolongeramajorissueintheEuropeansociety.Whatislackingisthecapacityforcitizenstoparticipateonequalfootingastheyoftenlacktheresources(e.g.capital,knowledge)tobepartofthetransition.AspartoftheEC’sambitionforcitizenstoacquireabiggerroleinEUenergypolicies,theinstitutionalframeworkhasbeenfurtherdevelopedtoleveltheplayingfieldforcommunityenergyinitiativesandtoenhancecivicengagementintheenergytransitionThiscomesasaresultoftherecognitionthataproliferationandempowermentofenergycommunitiescanhelptackleclimate,socialandenergysecuritygoals,whileacceleratingthetransition,reducingenergypoverty,advancingcirculareconomyandinvolvinglocalcommunities150.The2018RED-IIDirectivesetsoutaframeworkfor‘renewableenergycommunities’whilethe2019RevisedInternalElectricityMarketDirectiveintroducednewrolesandresponsibilitiesfor‘citizenenergycommunities’.UndertheGreenDealandtheFit-For-55packageseveralpoliciesandlegislativeinitiativessuchastheEuropeanBauhausaimtostrengthentheconnectionbetweencitizens,industry,institutionsandtheenergytransition.Onthelegislativefront,theproposalforamendingtheRED-IIDirectiveurgesfornationalmeasurestosubstantialincreasetoenergycommunities.SimilarlytheproposalforarecastoftheEnergyEfficiencyDirective151urgesMemberStatestopromotetheroleofenergycommunitiesandnamesthemasakeysocialpartners.TheREPowerEUplanandthelegislativeinitiativesgivemajorboostonenergycommunitieswithmultiplereferencespromotingtheirroleaspartofacleansafeandfairtransition.ThiscomesafterthenewGuidelinesonStateAidforclimate,environmentalprotectionandenergy152thatencourageMSstoexemptrenewableenergycommunityprojectswithinstalledcapacityequaltoorbelow6MWfrommandatorycompetitivebiddingprocesses,ortofacilitatetheirparticipationinsuchprocesses.TheEU‘SaveEnergy’Communicationurgesfortailor-madehands-onsupportatlocalleveltoadvisecitizensonthepossibilitiestoparticipateinanrenewableenergycommunity.TheREPowerEUPlan[SWD(2022)230final]encourageenergycommunitiesgenerationinthebiogassector.TheEUSolarEnergyStrategyCommunicationaspartoftheEuropeanSolarRooftopsInitiativeaimstosetupby2025atleastonerenewableenergycommunityineverymunicipalitywithapopulationhigherthan10000.Partoftheinitiativearealsoprovisionsthatensurethatenergypoorandvulnerablehouseholdshaveaccesstosolarenergyviasocialhousinginstallations,energycommunities,orfinancingsupportforindividualprojects.Thecommunicationbuildsastrongcaseonhowcollectivesolarenergyprojectsprovideawaytosimultaneouslyreducetheconsumptionoffossilfuelsandaddressenergypovertyandvulnerability.MSareurgedtosupportpartnershipbuildingbetweenlocalauthorities,energycommunitiesandsocialhousingprojectstofacilitatetheuseandpenetrationofenergycommunitiestoreduceenergycosts.146BasedonEurObserv’ER.2022.TheStateofRenewableEnergiesinEurope.Edition2021–20thEurObserv’ERReport.147The2019SpecialEurobarometer492,onEuropeans’attitudesonEUenergypolicy.148The2021SpecialEurobarometer513onClimateChange.149ibid150Mikkonen,I.,Gynther,L.,Matschoss,K.,Koukoufikis,G.,Murauskaite-Bull,I.andUihlein,A.,Socialinnovationsfortheenergytransition,EUR30446EN,PublicationsOfficeoftheEuropeanUnion,Luxembourg,2020,doi:10.2760/555111,JRC122289.151COM(2021)558final152GuidelinesonStateAidforclimate,environmentalprotectionandenergy,2022)C80/0133Thedelaysinthetranspositionofthe2019InternalElectricityMarketDirectivetoeffectivelyallowconsumerstoparticipateinenergymarkets(individuallyorviaenergycommunitiesorcollectiveself-consumptionschemes)arealsorecognisedintheREPowerEUplan.MSsareurgedtomoveforwardwiththelegislativework;provideassistancesotoremovethebarriersenergycommunitiesface(e.g.accesstofinance,administrativecapacities,permittingandlicencingprocesses);providetechnicalexpertise;andestablishincentivesandadaptadministrativerequirementstothecharacteristicsofenergycommunities.343Strategicanalysis3.1CriticalmaterialsandindustrialvaluechainsAvailabilityofthenecessaryrawmaterialsandsmoothfunctioningoftherelevantvaluechainsisessentialfortheundisrupteddeploymentofthecleanenergytechnologies,fulfillingtheEUenergytransitiontargets.ThematerialsandvaluechainsnecessaryforeachtechnologyhavebeenanalysedintheCETOreportsonspecifictechnologies(seeAnnex1),underthesectionon“Resourcesefficiencyanddependence”.Variousmaterialshavebeenidentifiedascriticalandstrategicforthesetechnologies,includingsteel,cement,copper,rareearths,compositematerials,ironalloys,siliconmetal,silver,lithium,nickel,graphite,cobalt,etc.FacedwiththechallengeofreducingEUdependenceonRussianfossilfuels,ontopoftheclimatecrisis,theCommissionadoptedon18May2022theREPowerEUPlan.Theinitiativesetsambitioustargetsanddetailsspecificactionsforboostingthedeploymentofrenewables,mainlywindpowerandsolarphotovoltaic(PV),hydrogenproduction,rapiddeploymentandwideuseofheatpumpsforheatingandcooling,andbatteriesforenergystorageanddecarbonisationofthetransportsector.Consequently,thedemandforrawmaterials,processedmaterials,componentsandassembliesisexpectedtogrowconsiderably,makingextremelyimportanttosecureaccesstothenecessaryquantitiesofthecriticalmaterialsandresilienceoftherelevantsupplychains.TheproposedEuropeanCriticalRawMaterialsActwillaimtocreateasecure,affordable,andsustainableaccesstothenecessarymaterialsandensuretheresilienceoftherelevantsupplychains.Thefollowingsummarisesthematerialsandthestageinthevaluechainwherebottlenecksaremostlikely(CriticalRawMaterials,CRMs,inItalics):—Windturbines:Rareearthsforpermanentmagnets(Neodymium(Nd),Praseodymium(Pr),Dysprosium(Dy),Terbium(Tb)).Permanentmagnetsmanufacturingisthemostcriticalstepinthevaluechain.—SolarPVpanels:Siliconmetal(Si),Silver(Ag)forcrystallineSilicontechnologies(95%ofcommercialPVmarket),andIndium(In),Germanium(Ge),Gallium(Ga),Tellurium(Te),Selenium(Se)andCadmium(Cd)forthin-filmtechnologies(only5%ofcommercialPVmarket,butimportantforspaceanddefenceapplications).SolarPVcells(andtherelevantwafersbeforethat)isthemostcriticalstepinthevaluechain.—Batteries:Lithium(Li),Nickel(Ni),Cobalt(Co),NaturalGraphiteandManganese(Mn).Batterycellsarecurrentlytheweakestvaluechainstage,butdomesticproductionisincreasing.—Hydrogenelectrolysers:PlatinumGroupMetals(PGM)–specificallyPlatinum(Pt)andPalladium(Pd)–andIridium(Ir).Therawmaterialsstepofthevaluechainisthemostcritical.Whileacompleteinter-comparisonofthevaluechainsofthetechnologiesexaminedinPartAwillfollowinthenextstepsoftheProject,somefirstremarksandpreliminaryconclusionscanalreadybedrawn.Ingeneral,asitwasshowcasedwiththesetechnologieswhichareessentialforthesuccessofREPowerEU,eachofthesupplychainsinvolvesdifferentcriticalmaterialsandhasitsownweaknesses/criticalities,thusrequiringcustomisedsolutions.Anexceptiontothisgeneraltrendisthesimilaritybetweenthevaluechainsofwindturbinesandthoseoftractionmotorsofelectricvehicles.Indeed,theybothrequirepermanentmagnets(thoughinquantitiesofcompletelydifferentscale)which,forreasonsofincreasedefficiency,userareearthelements.Similarly,manyofthecleantechnologiesdeployedinremoteplacesrequirelargequantitiesofcopperforwiringandconnectionwiththeelectricitygrid.Duetotheextensiveuseofcopperinelectricitygrids,anddespitethefactthatitisnotincludedintheEC2020listofcriticalrawmaterials,itisconsideredastrategicmaterialforthedecarbonisation.Furthermore,aluminium(forsupportstructures),ironalloys(e.g.forpiping)andotherbasemetalsappearinthevaluechainsofmorethanonetechnologiesandrequirefurtheranalysis.InthenextphasesofCETO,adetailedanalysisoftherelationshipsbetweenthedifferentcleantechnologiesvaluechainswillbecarriedout,coveringinter-comparisonforcomplementarities,identificationofstrategicnuclei,criticalindividualvaluechainsandcross-cuttingelements.Theanalysiswillbenefitfromtheon-goingupdateoftheCommission’s2020foresightstudy153oncriticalrawmaterials,extendingthescopeto15strategictechnologiesin5sectors.Thiswillincludethemostrecentdataonpresentandfuturematerialsuseincleanenergytechnologies,severalofwhichcontinuetoevolverapidly.153Bobba,S.,Carrara,S.,Huisman,Jaco,Mathieux,F.,Pavel,C.,CriticalRawMaterialsforStrategicTechnologiesandSectorsintheEU-AForesightStudy,Europeancommission,2020,DOI:10.2873/58081353.2Sustainability3.2.1Statusforenvironmental,social,economicandgovernanceaspectsEnergysystemsmustbesustainableintermsoftheirenvironmental,social,andeconomicperformance.TheEuropeanGreenDealistheEU'slong-termgrowthplantomakeEuropeclimateneutralby2050.Cleanenergytechnologiesareattheheartofthisplan.Knowingthecarbonfootprintofacleanenergytechnologyisthereforefundamental.This,andotherspecificpolicies,promotebothmorecompetitiveandsustainableindustriesacrossEuropeincluding,forexample,throughmandatorythresholdsoncarbonfootprintsuchasproposedinarticle7oftheBatteryRegulationproposal(COM(2020)798final).Policiessuchasthisforbatteriescontributetoreducingbothenvironmentalandsocialimpactsalongthewholevalue-chain,promotingtheadoptionofmoresustainableandcirculartechnologiesinvariousapplications.Suchpoliciesaresupportedintheenvironmentalcontextatthevaluechainlevelbye.g.ProductEnvironmentalFootprint(PEF)60andassociated“ProductEnvironmentalFootprintCategoryRules(PEFCR)fordifferenttechnologies.ForexamplePEFCRforbatteries154andPVpanels155alreadyexist.This,andassociatedproductpolicies,complementmoresite/technology-specificanalysesandrequirements.Fromthesocialside,SocialLifeCycleAssessmentisbeingappliedtospecificenergytechnologies,suchasforexamplebatteries156andhydrogen157.Inthepolicyarena,somehorizontalmandatoryrequirementsexistforsomerawmaterialvaluechainsatEU-levelinthecontextofduediligence.Again,thesearecomplementedbyotherschemeswithmandatoryandvoluntaryrequirementsforothermaterialsandcomponentscontainedinspecifictechnologies.Forexample,duediligenceprovisionsaresuggestedonsocialandenvironmentalriskcategoriesintheBatteryRegulationproposal(COM(2020)798final).Relatedstudies158suggestthatresponsiblesourcingschemescanpositivelyimprovethesocialperformanceofthelifecycleofbatteries.EnhancedCircularEconomystrategiesaimtomaximizethevalueofmaterialsbyextendingthelifespanofproductsinwhichtheyareembedded(e.g.throughreuseandsecond-use)andrecirculatingsecondarymaterials(e.g.throughrecycling).Hence,currentcircularityperformancesofenergytechnologiesandembeddedcomponentsandmaterialsneedtobemoresystematicallyassessed.Doingso,improvementopportunitieswillbeidentifiedtoimproveresourceefficiencyandrecycling,throughe.g.betterproductdesign,improvedcollectionandtreatmentpractices.Thiscanbedoneeitherthroughvoluntaryapproaches,orthroughpolicyinterventions(e.g.batteryregulationproposaladdressingsecond-use,designfeatures,recycledcontent,collectiontargetsandrecyclingperformances).Improvedcircularitywill,inprinciple,positivelyimpactthesustainabilityofcleanenergytechnologies.ConcerningEUautonomy,theEC’smethodologyoncriticalrawmaterials(CRMs)considershighrisksofsupplydisruptionduetomaterialscomingfromalimitednumberofcountriesthatareoftenassociatedwithpoorgovernance.Equally,CRMsareassociatedwithsectorswithahighaddedvalue.Duetothelinkwithpoorgovernance,criticalrawmaterialsmayalsobeassociatedwithpoorenvironmentalandsocialperformance;whilethesearenotroutinelyassessed.Hence,CRMsprovideanimportantbasisforanalysingpotentialsupplychainriskforcleanenergytechnologiesforextractionandprocessingofrawmaterials.Thesearealsocomplementedbyforesightanalysestoconsideralsoothersemi-finishedgoodsinthesupplychainsandthatfocusonfuturedemand159.Otheranalyses,suchasforbatteries,providemorein-depthmodellingofvaluechains,relateddemand,andalsowhatisactuallyfeasible/likelyinrelationtosupplyofbothprimaryandsecondaryrawmaterialse.g.:RMIS–RawMaterialsintheBatteryValueChain(europa.eu).Suchmodelinsightscouldbeextendedtoforesightanalysesofeconomic,social,andenvironmentalconsiderations.QualitativeandquantitativeanalysesofsustainabilityperformanceforcleanenergytechnologiesinCETOhighlighttheheterogeneousandlimitednatureofavailableinformationanddata.Methodologiesused(e.g.PECFRforLifeCycleAssessment)arealsonotavailableforalltechnologiesTheyequallyhighlightthatdifferentcategoriesofconsiderationsarerelevantdependingonthetechnologyfore.g.directimpactsandperceptions.Fromalifecycleassessmentperspective,includingforcarbonfootprints,datacanbelimitedforsome154https://ec.europa.eu/environment/eussd/smgp/pdf/PEFCR_Batteries.pdf155https://ec.europa.eu/environment/eussd/smgp/pdf/PEFCR_PV_electricity_v1.1.pdf156seechapter5ofJRCSASLABTechnicalreport(2018):https://publications.jrc.ec.europa.eu/repository/handle/JRC112543157EynardU.,MartinGamboaM,ValenteA.,ManciniL.,ArrigoniMaroccoA.,WeidnerRonnefeldE.,MathieuxF.(2022).S-LCAappliedtohydrogentechnologiesinEurope:challengesforcriticalrawmaterials’responsiblesourcing.PresentedatInternationalConferenceofSocialLifeCycleAssessment(S-LCA2022)Sept8th2022,Aachen,Germany.158https://www.sciencedirect.com/science/article/pii/S0301420721000325159Seee.g.https://rmis.jrc.ec.europa.eu/?page=crms-in-strategic-sectors-and-technologies-e8c63236technologiesandmayalsonotbebasedondetailedanalysisrequirements.Someexamplesofconsiderationsforselectedtechnologiesandendpoints:Batteries:—Cost-effectivebatteries(includingsecond-usedEVbatteries)cancontributetoincreasingtheself-consumptionandself-sufficiencyofelectricityend-users/prosumers,especiallyinruralareas.Theyhencecontributetoenergysecurityandquality74.—Thebatteryindustrydevelopmentcanhaveakeyrolein“ensuringtheaccesstoaffordable,reliable,sustainableandmodernenergyforall(SDG7)”.—BatterytechnologyisrapidlyevolvingandbothR&D&IactivitiesaswellasindustrialinitiativesarecurrentlyengagedtobuildamorecompetitiveandsustainableEuropeanbatteryindustry(EBA250,BatteriesEurope,Battery2030+,etc.).—“ProductEnvironmentalFootprintCategoryRules(PEFCR)forHighSpecificEnergyRechargeableBatteriesforMobileApplications”61werepublishedin2018.RevisionsareongoingtokeyparameterssuchasclimatechangebenchmarkstosupportArticle7oftheBatteryregulationproposal,whichforeseesthedeclarationofthecarbonfootprintofbatteriesthatareputintheEUmarket,topromotetheadoptionofmoreenvironmentally-friendlyproducts.—SupportingstudiestothePEFCRhavenotidentifiedspecifichotspotsthereforetheimpactofbatteriesonecosystemandbiodiversity“isnotatthemomentofconcern”.—NosignificantimpactsonlandusehavebeenidentifiedbythesupportingPEFCR.—Directive2006/66/ECoftheEuropeanParliamentandoftheCouncilof6September2006onbatteriesandaccumulatorsandwastebatteriesandaccumulatorsandrepealingDirective91/157/EEC,alreadyprohibitstoputintotheEUmarketbatteriesandaccumulatorcontaininghazardousmaterials,withspecificreferencetomercuryandcadmiumabovespecificthresholds.—SeveralmaterialsbelongingtotheCriticalRawMaterialsListfortheEU66areusedinmanufacturingbatteries;thedemandofsuchbatteriesisexpectedtorapidlyincreaseinthenextdecadefollowingthetrendofthebatteriesdemandinvarioussectors(e.g.mobility,energystorage,portabledevices)67.—Theadoptionofmoreresource-efficientbatteriesandtheincreasedflowsofsecondarymaterialsobtainedfrombatteriesrecyclinghaspotentialtomaximizethevalueofmaterialsandtokeepthemwithintheEU,hencedecreasingtheEUdependencyfromimports.ThenewBatteryRegulationproposalforeseesprogressiveminimumrecyclingefficienciesforlead-acid,Li-basedandotherwastebatteries.Inaddition,specificmaterialsrecoverylevelsneedstobeachievedforcobalt,cobalt,copper,lead,lithiumandnickel.—Recentanalysisshowsthat,startingfrom2030,theflowofmaterialsavailableforrecyclingisexpectedtobequiteimportantintermsofsecondarysupply70.—TheBatteryRegulationproposalstatesthatrechargeableindustrialbatteriesandEVbatterieswithacapacityabove2kWhareaccompaniedbyadocumentationreportingtheduediligencepoliciesadoptedalongthebatteriesvaluechain.Informationonspecificmaterialsrelatedriskembeddedinbatteriesareavailablein(Mancinietal.,2020)—Analysesidentifyingsocialhotspotsalongthebatteryvaluechainareprovidedby(Bobbaetal.,2018)and(Eynardetal.,2018).Moreover,ananalysisofsocialriskinbatteryrawmaterialssupplyisprovidedin(Mancinietal.,2020)while(Mancinietal.,2021)investigatesthesocialimpactsofresponsiblesourcinginitiativesinartisanalcobaltminingsitesintheDemocraticRepublicoftheCongo.Photovoltaics:—AtinternationalleveltheIEAPVPSTask12groupissuedmethodologyguidelinesonPV-specificparametersusedasinputsinLCA(Frischknechtetal.,2016).‘ProductEnvironmentalFootprintcategoryrules’forPVpowersystems10weredevelopedbytheECintheframeworkoftheProductEnvironmentalFootprintinitiativepilotphase.—Intermsofclimatechange,thin-filmmoduleshavethelowestemissions,followedbypoly-crystallinesiliconandthenmono-crystallinesilicon.Thereisconsiderablescopetoreducethesevalues,andprojectionsfor2050indicatethatlifecycleemissionsforPVcandropto10gCO2-eq/kWhandbelow(Pehletal.,2017).37—TheEnergyPaybackTimeofPVsystemsisdependentonthegeographicallocation:PVsystemsinNorthernEuropeneedaround1.2yearstobalancetheinputenergy,whilePVsystemsintheSouthequaltheirenergyinputafter1yearandless,dependingonthetechnologyinstalledandthegridefficiency(FraunhoferISE,2022b).—TheECpublishedareportonthepotentialimpactsofPVapplicationsontheecosystemandthebiodiversity(Lammerantetal.,2020).—Someoftherawmaterialsusedtomanufacturesolarcellsarecritical,suchasborates,siliconmetal,germanium,indium,andgallium.Moreover,thecriticalityofphotovoltaictechnologygoesbeyondtherawmaterialsavailability.ChinadominatesnearlyallaspectsofsolarPVmanufacturinganduse.—IntheEU,treatmentofend-of-lifePVmodulesmustcomplytheWEEEDirectivesince2012.Severalorganisationshavedevelopedrecyclingprocesses.SeveralsustainabilityaspectsarebeingaddressedintheframeworkEcodesign(EC,2022b).—Ardente,F.et.al.,2019assessedtheresourceefficiencyandrelatedenvironmentalbenefitsandburdensofapilotPVwasterecyclingprocesses.Overall,recyclingprocesseswithhigh-efficiencycanrecycleupto83%ofthewastepanel.AnongoingEU-fundedprojectcalledPHOTORAMAiscurrentlyworkingtoimproverecyclingofPhotovoltaic(PV)panelsandrecoveryofRawMaterials(RM).Wind:—Therearenotechnologyspecificguidelines.Lifecycleinventorydataofdifferingqualitiesareavailableine.g.studiesofthemainwindturbinemanufacturers(Vestas,SGRE).Manufacturersprovidenodetailedlifecycledataonthelatestoffshorewindturbines.—TheEnergyPay-BackTimeofwindenergysystemsisdependentonthecapacity(MW)oftheturbineaswellasitsgeographicallocation(capacityfactor);oftenbeingbetweencirca6to12months.—Windenergytechnologiescanrelyoncriticalrawmaterialssuchasdysprosium,neodymium,praseodymium,terbiumandborate.TheEUimportrelianceofsuchmaterialsishigh.—Mostmaterialsofwindturbinescanberecycled,howevercompositewasteposeschallenge.Beyondthecurrentapproachestokeepcompositewastefromwindturbinebladesoutoflandfill,innovationsandmeasuresforcirculareconomystrategiesareobservedinotherwindturbinecomponents(e.g.componentssuchasthetower,mooring,nacellehousingandgridintegrationtechnologies.—Thelackofeconomicallyviablepermanentmagnetsrecyclingprocesses,combinedwithnon-separatecollectionwasteflowreducethepotentialavailabilityofsecondaryrawmaterialsfromwindturbines.—TheadoptionofmoreresourceefficientwindturbinetechnologiesaswellastheuseofalternativematerialstosubstituteCRMs,forexample,mayhavethepotentialtoreducethevaluechainimportdependencyandhelpkeepmaterialswithintheEU.3.2.2ConceptandneedsforanintegratedsustainabilityassessmentCleanenergytechnologiesmustbeassessedinarobust,consistentandqualityassuredmannerinthecontextofsustainability.Thisincludesinrelationtobothdirectimpactconsiderations,butequallyassessmentsmustanalyseentirevaluechains/lifecyclesassociatedwithdifferenttechnologies.Carbonfootprints,amongstothers,areessentialparametersinthecontextofcarbonneutralityandmustbeassessedusingafulllifecycleapproach.Foresightanalysesprovideinsightsintoautonomy,supplybottlenecksaswellasdemand,andequallyabasisforanalysesofeconomic,environmental,aswellassocialconsiderations.Benchmarksfordifferentconsiderationsarevital,includingtomonitor/communicateprogress.Suchbenchmarksarenowbeingusedforpotentialmandatoryentry-marketoncarbonfootprint,e.g.inarticle7oftheBatteryregulationproposal.Forsomekeyparameters,suchascarbonandenvironmentalfootprintsthataccountfortheentirelifecycle,theEU’sProductEnvironmentalFootprintrequirementscanbedirectlyapplied.ProductEnvironmentalFootprintCategoryRulesalsoexistalreadyforsomecleanenergytechnologies,providingfurthermoredetailedanalysisspecificationstofacilitatecoherenceandqualityassurance.TheEuropeanPlatformonLifecycleAssessmentoffersreferencesmethodsanddata(throughtheInternationalLifeCycleDataNetwork).38Forothersustainabilityparameters,data,monitoring,andassessmentmethodologiesmaybelacking.SocialLifeCycleAssessmentcouldbehelpfultoassesssocialconsiderationsbutrequiresfurtherdevelopmentforcleanenergytechnologyanalyses;bothforcurrentandforwardlookingperspectives.Circularityisincreasinglyakeyfocus.Quantificationofcurrentandfuture-potentialcircularityopportunitiesisvitalformostcleanenergytechnologies.Theeconomic,environmentalandsocialimplicationsofdifferentcurrent/futurecircularitypotentialandoptionscanbeassessedinexistinglifecycleassessmentframeworksusingdetailedmodellingofvaluechains.Inthisrespect,theEC’sRawMaterialsInformationSystem(RMIS)offerssomerelevantreferencesdataonrecyclingratesofrawmaterials160andmaterialsstocksandflowsdatasetsonspecifictechnologies,forexamplebatteries161.Fortheanalysesofvaluechainsinrelationtocurrentandfutureorientatedautonomy(security-of-supplyrisk,criticality,resilience),noECguidanceexists.Neverthelessanalysesareconductedusingdetailedandsimplifiedmodellingapproaches,seee.g.JRC’sRawMaterialsInformationSystem.Again,suchanalysescanbeconductedaspartofbroaderanddetailedlifecycleassessments.Clearly,significanteffortsarenownecessarytocometoagreedmodellingandanalysesmethodologies(E.g.PEFCR,S-LCAguidelines),datasetsandmeaningfulindicators(suchascircularitycriteria)tobeappliedtospecificenergytechnologies,sothatsustainabilityperformancescanbeappropriatelydiscussedacrosstechnologiesandmonitored..3.2.3RoadmapforfurthersustainabilityassessmentsCETOhasconductedinitialqualitativeanalysesforselectedsustainabilitycriteriaofcleanenergytechnologies(TasksA1andA2).Thesequalitativeanalysesshouldbefurtherexpandedandmaintainedthroughmoredetailedstudiesbutfocusingonalimitedsubsetofparameters.Itmaybegoodtomakecleardistinctionsbetweeneconomic,social,andenvironmentalconsiderations.Equally,asplitcanbemadebetweendirectimpactsandthoseassociatedwithvaluechains.Atthesametime,developmentisrecommendedofquantitativemodellingforanalysisofvaluechainsandoffuturepotentialforselectedcleanenergytechnologiesforselectedpolicyendpoints(autonomy,circularity,climate,environmental,socialandeconomic).Thiscouldbedoneinitiallyforthemostdominantcleantechnologies,buildingone.g.examplesofmoreadvancedvaluechainanalyses/modellingsuchasforbatteries.3.3SWOTanalysisThesectionaimstoprovideoverallSWOTanalysesforglobalcompetitiveness,technologyindependenceandsustainabilityandbuildsontheanalysismadeforeachtechnologyandreportedintheindividualreportslistedinAnnex1.Table3showstheanalysisforglobalcompetitiveness,interpretedhereaccordingtothefollowingcriteria:CapabilityofEUorganisationsandcompaniestomanufacture,supply,deployandoperatecleanenergyEUcapabilitytocreateandmaintainanenvironmentthatsustainsmorevaluecreationforitsenterprisesandmoreprosperityforitspeople.Table4showstheSWOTaddressingtechnologyIndependence,wherethisisconsideredtobesynonymouswiththetermtechnologysovereigntyasdefinedbythe2021study162oftheEuropeanParliamentaryResearchService’sScientificForesightUnit:“…theabilityforEuropetodevelop,provide,protect,andretaincriticaltechnologiesrequiredforthewelfareofEuropeancitizensandprosperityofbusinesses,andtheabilitytoactanddecideindependentlyinaglobalisedenvironment.”163FinallyTable5considersthesocio-environmentalsustainabilityofthecleanenergytechnologysectorintheEUcontext.160https://rmis.jrc.ec.europa.eu/?page=scoreboard2021#/ind/15161https://rmis.jrc.ec.europa.eu/apps/bvc/#/v/apps162KeyenablingtechnologiesforEurope'stechnologicalsovereignty,STOAEuropeanParliament,2021,PE697.184,I,doi:10.2861/24482,QA-01-21-349-EN-N163TheSTOAdefinitionencompassesthreekeyelements:•Technological–thedevelopmentofEuropeanresearchanddevelopment(R&D)competenciesbymaintainingastrongknowledgebase,industry,andnetworksinthecriticaltechnologies;•Economic–theachievementandpreservationofapositionofleadershipinkeyenablingtechnologies(KETs),theabilitytoturnR&Dintomarketproducts,andaccesstoadiversityofresourcesalongthevaluechainwiththeaimofreducingdependenceonthirdcountries;39Table3.CETOSWOTanalysisofglobalcompetitivenessfortheEUcleanenergytechnologysector.Strengths—Reputationasproviderofreliabletechnologysolutions:e.g.offshorewind,CSP,hydropower.—R&I:strongpublicfunding,high-standingoftheEUresearchcommunity,impactfulcoordination(SETPlan):leaderonhighvaluepatents—Productionequipment:e.g.forPV,batteries,bioenergy—World-leadingprojectdevelopment,capabilitytoexecutecomplex,high-performance,largescaleengineeringprojects:e.g.powerblocks,chemicalsystems—Digitalsystemsandsolutionsalreadyimplementedinseveralsectors—Keyplayerininternationalstandards(industrial,environmental,ESG)Opportunities—Growingglobalmarketforcleanenergytechnologiesneededtoachieveclimatechangemitigationgoals—Higherfossilfuelpricesandsecurityofsupplyconcernsdrivinggreeninvestments—Demandforsustainablesolutions—UpdatedEUindustrialstrategy—EUcarbonmarketscanhelpdeploylarge-scalegreenindustriesandsupportinvestmentsforR&I—AdditionalinvestmentfromRRPandInnovationFund,—SteadilygrowingVCandcompetitiveVCecosystems(PV,heatpumps,grids)—Workforcewithrelevantskills—Integratedcross-sectorialsolutions(e.g.energy+infrastructure,energy+agriculture)Weaknesses—Highenergyandproductioncosts—Externaldependenciesforsomematerialsandcomponents—Skilledworkersshortagesandgender-imbalanceforSTEMfields—LowerprivateR&Ifundingcomparedtomaincompetitors.—Innovation“valleyofdeath”,fundingforfirst-of-a-kindplants—Investment,financingofnewtechprojects(risk-premium)—Administrativebarriers(e.g.longpermit-grantingprocess)forinvestmentsThreats—FallingbehindinR&I—InfringementofIPR—DivergentMSpoliciesand/orinvestmentuncertainties—Subsidisedinternationalcompetition—Lowercosttechnologysolutionsfrominternationalcompetitors—Unfavourablegeopoliticaldevelopments—Squeeze-outofsomedevelopingtechnologiesSource:JRCanalysis•Regulatory–thedevelopmentofadequatepoliciesandstandardsthatreflectEuropeanvalues,toinfluenceglobalregulation,standardsandpractices40Table4.CETOSWOTanalysisoftechnologyindependencefortheEUcleanenergytechnologysector.Strengths—Technicalcapabilitytoproduceallcleanenergytechnologies—Innovativecapability—Expertiseininstallationandoperations—TechnologyexpertiseandR&D—IPCEIprocesstoaddresskeyareas(e.g.batteries,hydrogen)—Pilotplants:e.g.CCSU,biofuels,oceanOpportunities—EUmarketgrowthcandrivere-developmentofmanufacturingbase—Developsubstitutesforcriticalmaterialsandenhancingrecycling—ProductsforcirculareconomyandESG-compliant—Diversificationofimporterstoenhanceresilience(triggeredbyRussianwar)Exportpotentialforhigh-endsustainableenergytechnologyWeaknesses—Scale-upofmanufacturing(toreducecosts)—FundingofFOAKplants—Importofmanyelectronicscomponents—Digitalintelligence(forgrids,smartcitiesetc)—LossofIPR—ManyEUminingactivitiesclosed(rawmaterials)—Criticalrawmaterials:highdependencyonthirdcountriesThreats—Lossofskillsandexpertise—Timescalestodevelopmentnewlarge-scalemanufacturingfacilities(solarglass)—Potentialdisruptionsinthesupplychainduetoeconomic/geopoliticalcircumstancesSource:JRCanalysis41Table5.CETOSWOTanalysisofsocio-environmentalsustainabilityforthecleanenergytechnologysectorStrengths—EUpolicyframework(taxonomy,circulareconomy,socialjustice)—Solutionsavailableforreducedenvironmentalimpact(onland,water,air,andforbiodiversity)—DevelopedEUre-cyclingtechnologyandcapacities(e.g.PV)—SynergiesbetweendifferentSDGsOpportunities—KnowonsustainabilitywithEUcompaniesassolutionproviders—Lowandhigh-skillemploymentgrowth—Betterproducts,lowerlifecosts(lessO&M)—Avoidprogrammedobsolesce—GlobaliseESGstandardsWeaknesses—EUdependenceonCRMs—Recylingindustrypendingmaterialinput—Manycasesofdown-cyclingratherthanre-cycling—ESGcontrolofimportedmaterialsandgoodsThreats—Highercostsofrecycledmaterials—Shorttermcostgainsvs.longtermsustainabilitySource:JRCanalysis424ConclusionsThisreportprovidesastrategicanalysisoftheEUcleanenergytechnologysector,tocomplementtheCETOindividualtechnologyandsystemintegrationreports.Themainfindingsaresummarisedasfollows:Cleanenergytechnologiesarecontributingtotrendofdecreasingenergyconsumptionandenergyintensity.Withincreasingrenewablesintheenergymix,GHGintensitieshavealsodecreased.TheEUhasoneofthelowestvalueofGHGemissionsperunitofGDPamongthemajorglobaleconomies.IncreasingtheshareofrenewableenergyproducedintheEUcanalsomitigatecurrenthighcostsandtheirnegativeimpactonthecompetitivenessoftheEUindustryingeneral.WhiletheEUoveralleconomycontractedby4%intheEUin2020,grossvalueaddedofrenewableenergysectorincreasedby8%,andturnovergrewby9%in2019-2020.Lookingmorebroadlyatthecleanenergysector,thishasanearly70%higherratioofgrossvalueaddedtoturnoverratiothanintheoverallmanufacturingindustryintheEU.In2021,theEUproductionvalueofmostcleanenergytechnologiesandsolutionsincreased,reversingthe2020decline.Nevertheless,thesimultaneousincreaseofpricesmaygiveanoverlypositivepictureofproductiongrowth.Inaddition,sometechnologiesexperiencedanincreaseofimportstomeetthegrowingdemandintheEU.EUemploymentintherenewablesremainedatabout1.3millionovertheperiod2015to2020,butthedistributionofjobsamongtechnologieschanged,withheatpumpsovertakingsolidbiofuelsandwindenergytobecomethelargestemployerin2020.Ifenergyefficiencyande-mobilityareincluded,cleanenergysectoremploymentclimbsto1.8million(1%oftheEUtotalemployment).Asignificantgendergapcontinues,butanalysisishamperedbyalackofconsistentgender-disaggregateddata.Fromtheavailabledataonpatentsandventurecapitalinvestment,itemergesthatwomeninventorswereonlyjustover15%forclimatechangemitigationtechnologies.Theshareofstart-upsfoundedorco-foundedbywomenwaslessthan15%intheEUin2021.Anincreasinglynumberofinitiativesaimtostimulatewomen’sinvolvementininnovation,andhopefullytheimpactofthiswillsoonbecomeapparent.TheEUcontinuestobeagloballeaderfor‘green’inventionsandhigh-valuepatentsinclimatechangemitigationtechnologies.EUclimate-techstart-upsandscale-upshaveattractedanincreasingamountofventurecapital(VC)investmentsoverthelast6years,accountingfor15%ofglobalclimatetechVCinvestmentsin2021,morethanatwofoldincrease(x2.2)ascomparedto2020.NonethelessEU-basedscale-upsstilllagbehindcomparedtoothermajoreconomiesandfurtherinvolvementoftheprivatesectorwillbekeytoreversethistrend.StructuralbarriersandsocietalchallengesstillholdbackEU-basedclimatetechscale-upscomparedtoothermajoreconomies.DataonpublicR&IinvestmentsintheMemberStatesshowsincreasesbothintermsofabsolutespendingandasashareofGDPin2020,butstillremainbelowEU2010levelsinabsoluteterms.ConsideringbothMSandEUframeworkprogrammefunding,in2020,theEUwassecondinpublicR&Iinvestmentamongmajoreconomies,bothinabsolutespending:EUR6.6million(where,theUSleadswithEUR8million,)andasshareofGDP:0.046%,behindJapan0.058%andjustaheadofUSandKR.Analysisofsupplychainsacrossabroadrangeoftechnologiesidentifiedvariousmaterialsascriticalandstrategic,includingsteel,cement,copper,rareearths,compositematerials,ironalloys,siliconmetal,silver,lithium,nickel,graphite,cobalt,etc.WiththeREPowerEUplanexpectedtofurtherboostdemand,theproposedEuropeanCriticalRawMaterialsActwillaimtocreateasecure,affordable,andsustainableaccesstothenecessarymaterialsandensuretheresilienceoftherelevantsupplychains.TheCETOsustainabilityanalysesofindividualtechnologieshighlightedtheheterogeneousandlimitednatureofavailableinformationanddata.Methodologiesused(e.g.PECFRforLifeCycleAssessment)arealsonotavailableforalltechnologies.Theyequallyhighlightthatdifferentcategoriesofconsiderationsarerelevantdependingonthetechnologyfore.g.directimpactsandperceptions.ItisrecommendedthattheCETOqualitativeanalysesshouldbefurtherexpandedandmaintainedthroughmoredetailedstudiesbutfocusingonalimitedsubsetofparameters.Atthesametime,developmentisrecommendedofquantitativemodellingforselectedpolicyendpoints(autonomy,circularity,climate,environmental,socialandeconomic),buildingforinstanceontheworkdoneforbatteries.ThestudiesandanalysesperformedforCETOin2022haveunderlinedthecleanenergytechnologysector’sneedtoimprovethequalityandtimelinessofpublicdata,inparticularregardinginvestmentsandsocio-economicaspects.Thiscanbebringbenefitstopolicymakers,prospectiveinvestorsandsectorparticipants.43ListofabbreviationsanddefinitionsCEAPCirculareconomyactionplanCETPCleanEnergyTransitionPartnershipCPCcommonpatentclassificationESGEnvironmentalandsocialgovernanceETSEmissionTradingSystemFiTfeed-intariffFOAKFirst–of-a-KindGWGigaWattIAInnovationActionIEAInternationalEnergyAgencyIRENAInternationalRenewablesEnergyAgencyIPImplementationPlanIPCEIImportantprojectsofcommonEuropeaninterestIPRIntellectualpropertyrightsLCoElevelisedcostofelectricityMENAMiddleEastandNorthAfricaMS[EU]MemberStateO&MOperationsandmaintenancePEFCRProductenvironmentalfootprintcategoryrulePPApowerpurchaseagreementPVphotovoltaicREDrenewableenergydirective(RED-IIisthe2018revision)RESRenewableEnergySourceRIAResearchandInnovationActionSET-PlanEUStrategicEnergyTechnologyPlanSTEMScience,technology,engineering,mathematicsSWOTStrengths,weaknesses,opportunities,threats(analysis)TRLTechnologyReadinessLevelVCVentureCapital44ListoffiguresFigure1:Evolutionofmainindicatorsforenergyconsumption,GHGintensityandrenewablecontributiontotheenergysystem,alongwiththe2020valueand2030targets.....................................................................................................9Figure2:Importsofoilandpetroleumproducts,naturalgas,andsolidfossilfuelstotheEU,bysource,andimportingMemberState(thisisnotnecessarilytheend-userastheremaybetransformationsandre-exportswithintheEU),2019.........................................................................................................................................................................................................9Figure3:Snapshotoftechnology-fleetspecificlevelisedcostsofelectricity(LCOE)fortheyear2021.ThelightbluebarsdisplayarangeacrosstheEU27andthesolidbluelinesdenotemedian..............................................11Figure4:PublicR&IinvestmentsinEUMSasashareofGDPsincethestartofHorizon2020...............................15Figure5:PublicandprivateR&IinvestmentsinmajoreconomiesasashareofGDP....................................................15Figure6:R&D&IingreenactivitiesintheRRPsasashare(leftaxis)andabsoluteamount(rightaxis).TheR&DintensityvsGDP(rightaxis)isalsogivenforcomparison........................................................................................................16Figure7:PatentspermillioninhabitantsintheEnergyUnionR&IprioritiesperEUMSsincethestartofHorizon2020.....................................................................................................................................................................................................................17Figure8-Venturecapitalinvestmentsinclimate-techstart-upsandscale-ups...............................................................20Figure9-ShareofVCinvestmentsinEUClimateTechfirms,byapplicationsegment................................................21Figure10-ShareofVCinvestmentsinEnergyClimateTechfirms,byfirmlocation.....................................................21Figure11–VCinvestmentsinEnergyClimateTechfirms,bylocationandsegment(excludingnucleartechnologies)......................................................................................................................................................................................................................22Figure12-VCinvestmentsindigitalClimateTechfirmsintheEnergysector,byfirmlocation............................23Figure13-NumberofnewClimateTechfirmscreatedbyyearintheEnergydomainandshareofnewdigitalventures.................................................................................................................................................................................................................23Figure14-ShareofVCinvestmentsincleanenergyfirms91,byfirmlocationandstageofinvestments,excludinglargesingulardeals93.............................................................................................................................................................................25Figure15:LabourandmaterialshortagesexperiencedbyEUbusinessesinmanufactureofelectricalequipmentandtotalmanufacturingindustry[%]......................................................................................................................................2945ListoftablesTable1.CoverageofcleanenergytechnologiesinCETO,CINDECSandbytheEUIndustrialEcosystems............7Table2:EUparticipationinMissionInnovation2.0................................................................................................................................19Table3.CETOSWOTanalysisofglobalcompetitivenessfortheEUcleanenergytechnologysector..................39Table4.CETOSWOTanalysisoftechnologyindependencefortheEUcleanenergytechnologysector.............40Table5.CETOSWOTanalysisofsocio-environmentalsustainabilityforthecleanenergytechnologysector4146AnnexesAnnex1CETOreportseries2022TechnologyTopicCitationAdvancedbiofuelsHurtig,O.,Scarlat,N.,Motola,V.,Buffi,M.,Georgakaki,A.,Letout,S.,Mountraki,A.andJoannyOrdonez,G.,CleanEnergyTechnologyObservatory:AdvancedbiofuelsintheEuropeanUnion-2022StatusReportonTechnologyDevelopment,Trends,ValueChainsandMarkets,EuropeanCommission,2022,JRC130727.BatteriesBielewski,M.,Pfrang,A.,Bobba,S.,Kronberga,A.,Georgakaki,A.,Letout,S.,Kuokkanen,A.,Mountraki,A.,Ince,E.,Shtjefni,D.,JoannyOrdonez,G.,Eulaerts,O.andGrabowska,M.,CleanEnergyTechnologyObservatory:BatteriesforEnergyStorageIntheEuropeanUnion-2022StatusReportonTechnologyDevelopment,Trends,ValueChainsandMarkets,,EUR31220EN,EuropeanCommission,2022,doi:10.2760/808352,JRC130724.BioenergyMotola,V.,Scarlat,N.,Hurtig,O.,Buffi,M.,Georgakaki,A.,Letout,S.,Mountraki,A.andJoannyOrdonez,G.,CleanEnergyTechnologyObservatory:BioenergyintheEuropeanUnion-2022StatusReportonTechnologyDevelopment,Trends,ValueChainsandMarkets,EuropeanCommission,2022,JRC130730.CarbonCaptureUtilisationandStorageKapetaki,Z.,Eulaerts,O.,Georgakaki,A.,GonzalezSanchez,M.D.R.,Grabowska,M.,Ince,E.,JoannyOrdonez,G.,Kuokkanen,A.,Letout,S.,Mountraki,A.andShtjefni,D.,CleanEnergyTechnologyObservatory:CarbonCapture,UtilisationandStorageintheEuropeanUnion-2022StatusReportonTechnologyDevelopment,Trends,ValueChainsandMarkets,EUR31229EN,EuropeanCommission,doi:10.2760/268143(online),JRC130663.ConcentratedSolarPowerandHeatTaylor,N.,Georgakaki,A.,Letout,S.,Kuokkanen,A.,Mountraki,A.,Ince,E.,Shtjefni,D.,JoannyOrdonez,G.,Eulaerts,O.andGrabowska,M.,CleanEnergyTechnologyObservatory:ConcentratedSolarPowerandHeatintheEuropeanUnion–2022StatusReportonTechnologyDevelopment,Trends,ValueChainsandMarkets,EUR31255EN,PublicationsOfficeoftheEuropeanUnion,Luxembourg,2022,ISBN978-92-76-57686-0(online),doi:10.2760/080204(online),JRC130811.GeothermalheatandpowerBruhn,D.,TayloirN,Grabowska,M.,Ince,E.,JoannyOrdonez,G.,Georgakaki,A.,Kuokkanen,A.,Mountraki,A.andShtjefni,D.,CleanEnergyTechnologyObservatory:DeepGeothermalEnergyintheEuropeanUnion-2022StatusReportonTechnologyDevelopment,Trends,ValueChainsandMarkets,EuropeanCommission,2022,JRC130585HeatPumpsLyons,L.,Georgakaki,A.,Kuokkanen,A.,Letout,S.,Mountraki,A.,Ince,E.,Shtjefni,D.,JoannyOrdonez,G.,Eulaerts,O.andGrabowska,M.,CleanEnergyTechnologyObservatory:HeatPumpsintheEuropeanUnion–2022StatusReportonTechnologyDevelopment,Trends,ValueChainsandMarkets,EUR31268EN,PublicationsOfficeoftheEuropeanUnion,Luxembourg,2022,ISBN978-92-76-58572-5(online),doi:10.2760/372872(online),JRC130874.Hydropower&PumpedHydropowerStorageQuaranta,E.,Georgakaki,A.,Letout,S.,Kuokkanen,A.,Mountraki,A.,Ince,E.,Shtjefni,D.,JoannyOrdonez,G.,Eulaerts,O.andGrabowska,M.,CleanEnergyTechnologyObservatory:HydropowerandPumpedHydropowerStorageintheEuropeanUnion–2022StatusReportonTechnologyDevelopment,Trends,ValueChainsandMarkets,EUR31260EN,PublicationsOfficeoftheEuropeanUnion,Luxembourg,2022,ISBN978-92-76-58103-1(online),doi:10.2760/256255(online),JRC130587.OceanenergyTapoglou,E.,Georgakaki,A.,Letout,S.,Kuokkanen,A.,Mountraki,A.,Ince,E.,Shtjefni,D.,JoannyOrdonez,G.,Eulaerts,O.andGrabowska,M.,CleanEnergyTechnologyObservatory:Oceanenergy-2022StatusReportonTechnologyDevelopment,Trends,ValueChainsandMarkets,,EUR31219EN,PublicationsOfficeoftheEuropeanUnion,Luxembourg,2022,ISBN978-92-76-56962-6(online),doi:10.2760/162254(online),JRC130617.PhotovoltaicsChatzipanagi,A.,Jaeger-Waldau,A.,CleretDeLangavant,C.,Letout,S.,Latunussa,C.,Mountraki,A.,Georgakaki,A.,Ince,E.,Kuokkanen,A.andShtjefni,D.,CleanEnergyTechnologyObservatory:PhotovoltaicsintheEuropeanUnion–2022StatusReportonTechnologyDevelopment,Trends,Value47TechnologyTopicCitationChainsandMarkets,EUR31247EN,PublicationsOfficeoftheEuropeanUnion,Luxembourg,2022,ISBN978-92-76-57573-3(online),doi:10.2760/812610(online),JRC130720.RenewableFuelsofnon-biologicalorigin(other)Buffi,M.,Scarlat,N.,Hurtig,O.,Motola,V.,Georgakaki,A.,Letout,S.,Mountraki,A.andJoannyOrdonez,G.,CleanEnergyTechnologyObservatory:Renewablefuelsofnon-biologicaloriginintheEuropeanUnion-2022StatusReportonTechnologyDevelopment,Trends,ValueChainsandMarkets,,PublicationsOfficeoftheEuropeanUnion,Luxembourg,2022,JRC130729.HydrogenelectrolysisDolci,F.,Gryc,K.,Eynard,U.,Georgakaki,A.,Letout,S.,Kuokkanen,A.,Mountraki,A.,Ince,E.,Shtjefni,D.,JoannyOrdonez,G.,Eulaerts,O.andGrabowska,M.,CleanEnergyTechnologyObservatory:HydrogenElectrolysis--2022StatusReportonTechnologyDevelopment,Trends,ValueChainsandMarkets,EURxxxx,PublicationsOfficeoftheEuropeanUnion,Luxembourg,2022,JRC130683.SolarFuels(direct)Taylor,N.,JoannyOrdonez,G.,Eulaerts,O.andGrabowska,M.,CleanEnergyTechnologyObservatory:DirectSolarFuelsintheEuropeanUnion–2022StatusReportonTechnologyDevelopment,Trends,ValueChainsandMarkets,EUR31253EN,PublicationsOfficeoftheEuropeanUnion,Luxembourg,2022,ISBN978-92-76-57685-3(online),doi:10.2760/361656(online),JRC130836.Wind(offshoreandonshore)Telsnig,T.,Georgakaki,A.,Letout,S.,Kuokkanen,A.,Mountraki,A.,Ince,E.,Shtjefni,D.,JoannyOrdonez,G.,Eulaerts,O.andGrabowska,M.,CleanEnergyTechnologyObservatory:WindEnergyintheEuropeanUnion-2022StatusReportonTechnologyDevelopment,Trends,ValueChainsandMarkets,EUR31204EN,PublicationsOfficeoftheEuropeanUnion,Luxembourg,2022,ISBN978-92-76-56584-0(online),doi:10.2760/855840(online),JRC130582.SmartgridsPrettico,G.,DePaola,A.,Thomas,D.,Andreadou,N.,Papaioannou,I.andKotsakis,E.,CleanEnergyTechnologyObservatory:SmartGridsintheEuropeanUnion-U,EUR31237EN,PublicationsOfficeoftheEuropeanUnion,Luxembourg,2022,ISBN978-92-76-57215-2(online),doi:10.2760/276606(online),JRC130710.IndustrialandDistrictHeat&ColdManagementCarlsson,J.,Volt,S.,RocaReina,J.,Georgakaki,A.,Letout,S.,Kuokkanen,A.,Mountraki,A.,Shtjefni,D.,JoannyOrdonez,G.,Eulaerts,O.,Grabowska,M.andToleikyte,A.,CleanEnergyTechnologyObservatory:IndustrialandDistrictHeatandColdManagement,PublicationsOfficeoftheEuropeanUnion,Luxembourg,2022,JRC130726.Cleanenergyoutlooks:analysisandreviewTarvydas,D.,CleanEnergyTechnologyObservatoryCleanenergyoutlooks:analysisandcriticalreview,PublicationsOfficeoftheEuropeanUnion,Luxembourg,2022,JRC130719.Annex2CETOsustainabilityassessmentcheck-listThefollowingcheck-listwasdevelopedtoallowtheinformationavailableforeachtechnologytobesummarisedinacomprehensiveway.ThecompliedlistareavailableintheindividualreportslistedinAnnex1.Parameter/IndicatorInputEnvironmentalLCAstandards,PEFCRorbestpractice,LCIdatabasesY/N,reference(s)GHGemissionsRepresentativekgCO2eq/kWhEnergybalanceEROEI,EPBTifavailableEcosystemandbiodiversityimpactCommentifdataorreferencesorreportsfromsectorworkinggroupsavailableWateruseRepresentativem3/MWhforcurrenttechnologiesAirqualityCommentifissue(s)existLanduseRepresentativeW/m2formaincurrenttechnologies,whererelevantSoilhealthCommentifrelevantanddataavailableHazardousmaterialsNoteifusedinsupplychaine.g.REACHmaterialsEconomicLCCstandardsorbestpracticesAvailableY/N,reference(s)CostofenergyYes,LCoE,LCoS,LCoH,CAPEX,OPEX(orrefertoothersectionsinthisreport)CriticalrawmaterialsNoteifusedinsupplychainResourceefficiencyandrecyclingTbd(e.grecyclingrates)IndustryviabilityandexpansionpotentialYes,seemarketssectionTradeimpactsYes,seemarketssectionMarketdemandYes,seemarketssectionTechnologylock‐in/innovationlock-outCommentifdominanttechnologyortechnologyproviderTech-specificpermittingrequirementsCommentSustainabilitycertificationschemesY/N,reference(s)SocialS-LCAstandardorbestpracticeY/N,reference(s)HealthNoteknownissuesandrefsPublicacceptanceNoteknownissuesandrefsEducationopportunitiesandneedsEmploymentandconditionsForemploymentdataseesection3.5ContributiontoGDPseeVCanalysissectionRuraldevelopmentimpactCommentifrelevanttospecifictechIndustrialtransitionimpactCommentifrelevanttospecifictechAffordableenergyaccess(SDG7)CommentifrelevanttospecifictechSafetyand(cyber)securityCommentifrelevanttospecifictechEnergysecurityCommentifrelevanttospecifictechFoodsecurityCommentifrelevanttospecifictechResponsiblematerialsourcingNoteEUREGULATION(EU)2017/821requirementsifrelevantGETTINGINTOUCHWITHTHEEUInpersonAllovertheEuropeanUniontherearehundredsofEuropeDirectcentres.Youcanfindtheaddressofthecentrenearestyouonline(european-union.europa.eu/contact-eu/meet-us_en).OnthephoneorinwritingEuropeDirectisaservicethatanswersyourquestionsabouttheEuropeanUnion.Youcancontactthisservice:—byfreephone:0080067891011(certainoperatorsmaychargeforthesecalls),—atthefollowingstandardnumber:+3222999696,—viathefollowingform:european-union.europa.eu/contact-eu/write-us_en.FINDINGINFORMATIONABOUTTHEEUOnlineInformationabouttheEuropeanUnioninalltheofficiallanguagesoftheEUisavailableontheEuropawebsite(european-union.europa.eu).EUpublicationsYoucanviewororderEUpublicationsatop.europa.eu/en/publications.MultiplecopiesoffreepublicationscanbeobtainedbycontactingEuropeDirectoryourlocaldocumentationcentre(european-union.europa.eu/contact-eu/meet-us_en).EUlawandrelateddocumentsForaccesstolegalinformationfromtheEU,includingallEUlawsince1951inalltheofficiallanguageversions,gotoEUR-Lex(eur-lex.europa.eu).OpendatafromtheEUTheportaldata.europa.euprovidesaccesstoopendatasetsfromtheEUinstitutions,bodiesandagencies.Thesecanbedownloadedandreusedforfree,forbothcommercialandnon-commercialpurposes.TheportalalsoprovidesaccesstoawealthTheEuropeanCommission'sscienceandknowledgeserviceJointResearchCentreJRCMissionAsthescienceandknowledgeserviceoftheEuropeanCommission,theJointResearchCentre'smissionistosupportEUpolicieswithindependentevidencethroughoutthewholepolicycycle.II'EUScienceHubI!].·joint-research-centre.ec.europa.euCl@EU_ScienceHub0EUScienceHub-JointResearchCentreImEUScience,ResearchandInnovation!IEUScienceHub0EUScience

1、当您付费下载文档后,您只拥有了使用权限,并不意味着购买了版权,文档只能用于自身使用,不得用于其他商业用途(如 [转卖]进行直接盈利或[编辑后售卖]进行间接盈利)。
2、本站所有内容均由合作方或网友上传,本站不对文档的完整性、权威性及其观点立场正确性做任何保证或承诺!文档内容仅供研究参考,付费前请自行鉴别。
3、如文档内容存在违规,或者侵犯商业秘密、侵犯著作权等,请点击“违规举报”。

碎片内容

碳中和
已认证
内容提供者

碳中和

确认删除?
回到顶部