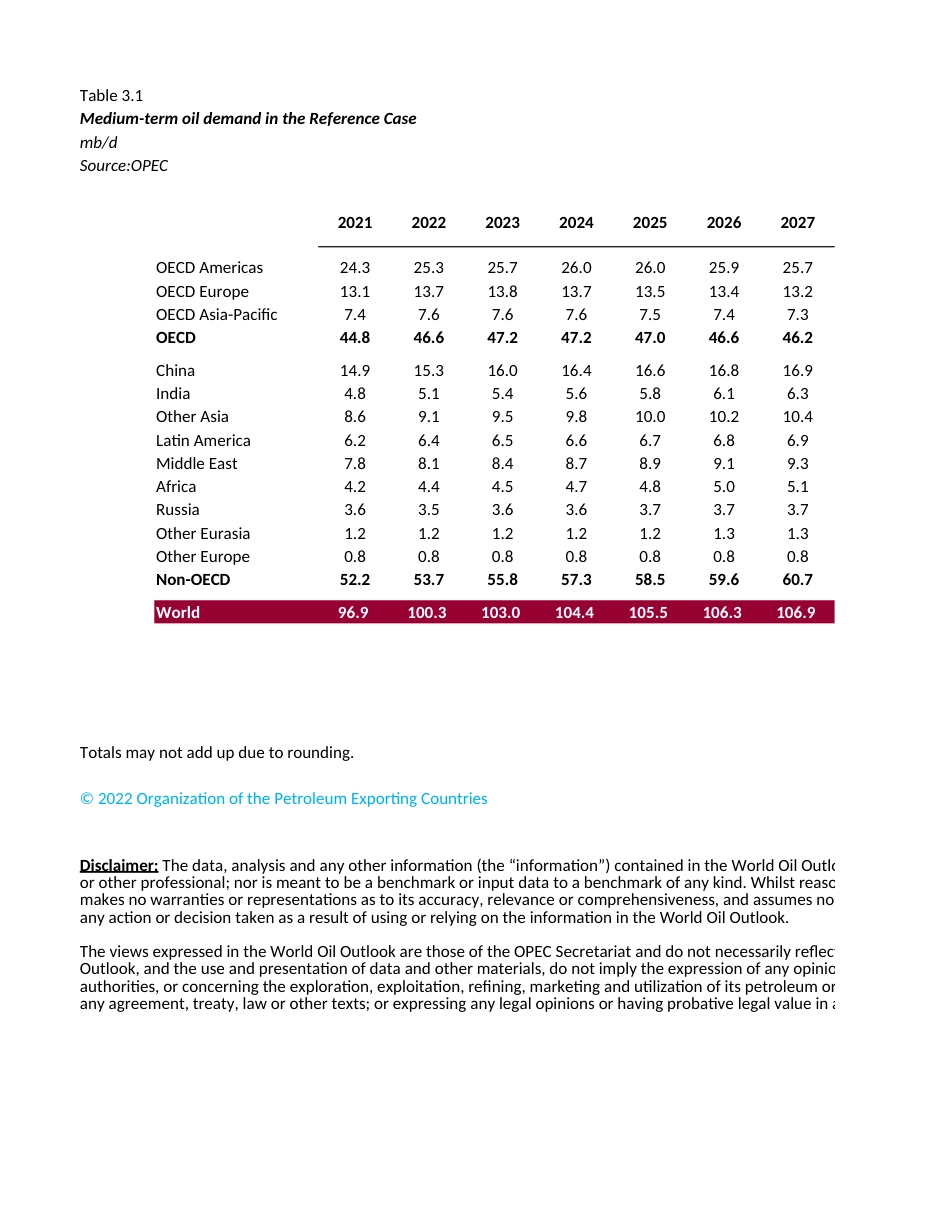
Table 3.1Medium-term oil demand in the Reference Case mb/d Source:OPEC2021202220232024202520262027OECD Americas24.325.325.726.026.025.925.7OECD Europe13.113.713.813.713.513.413.2OECD Asia-Pacific7.47.67.67.67.57.47.3OECD44.846.647.247.247.046.646.2China14.915.316.016.416.616.816.9India4.85.15.45.65.86.16.3Other Asia8.69.19.59.810.010.210.4Latin America6.26.46.56.66.76.86.9Middle East7.88.18.48.78.99.19.3Africa4.24.44.54.74.85.05.1Russia3.63.53.63.63.73.73.7Other Eurasia1.21.21.21.21.21.31.3Other Europe0.80.80.80.80.80.80.8Non-OECD52.253.755.857.358.559.660.7World96.9 100.3 103.0 104.4 105.5 106.3 106.9 Totals may not add up due to rounding.© 2022 Organization of the Petroleum Exporting CountriesDisclaimer: The data, analysis and any other information (the “information”) contained in the World Oil Outlook is for informaor other professional; nor is meant to be a benchmark or input data to a benchmark of any kind. Whilst reasonable efforts havmakes no warranties or representations as to its accuracy, relevance or comprehensiveness, and assumes no liability or respoany action or decision taken as a result of using or relying on the information in the World Oil Outlook. The views expressed in the World Oil Outlook are those of the OPEC Secretariat and do not necessarily reflect the views of its Outlook, and the use and presentation of data and other materials, do not imply the expression of any opinion whatsoever onauthorities, or concerning the exploration, exploitation, refining, marketing and utilization of its petroleum or other energy resany agreement, treaty, law or other texts; or expressing any legal opinions or having probative legal value in any proceedings.024Row 61Row 62Row 63Row 64Row 65Row 66Row 67Row 68mb/d024Row 72mb/d0Row 61Row 62Row 63Row 64Row...