2035年展望报告—降低太阳能、风能和电池的成本可以加速我们的清洁电力未来(英文版)--UC BerkeleyVIP专享VIP免费

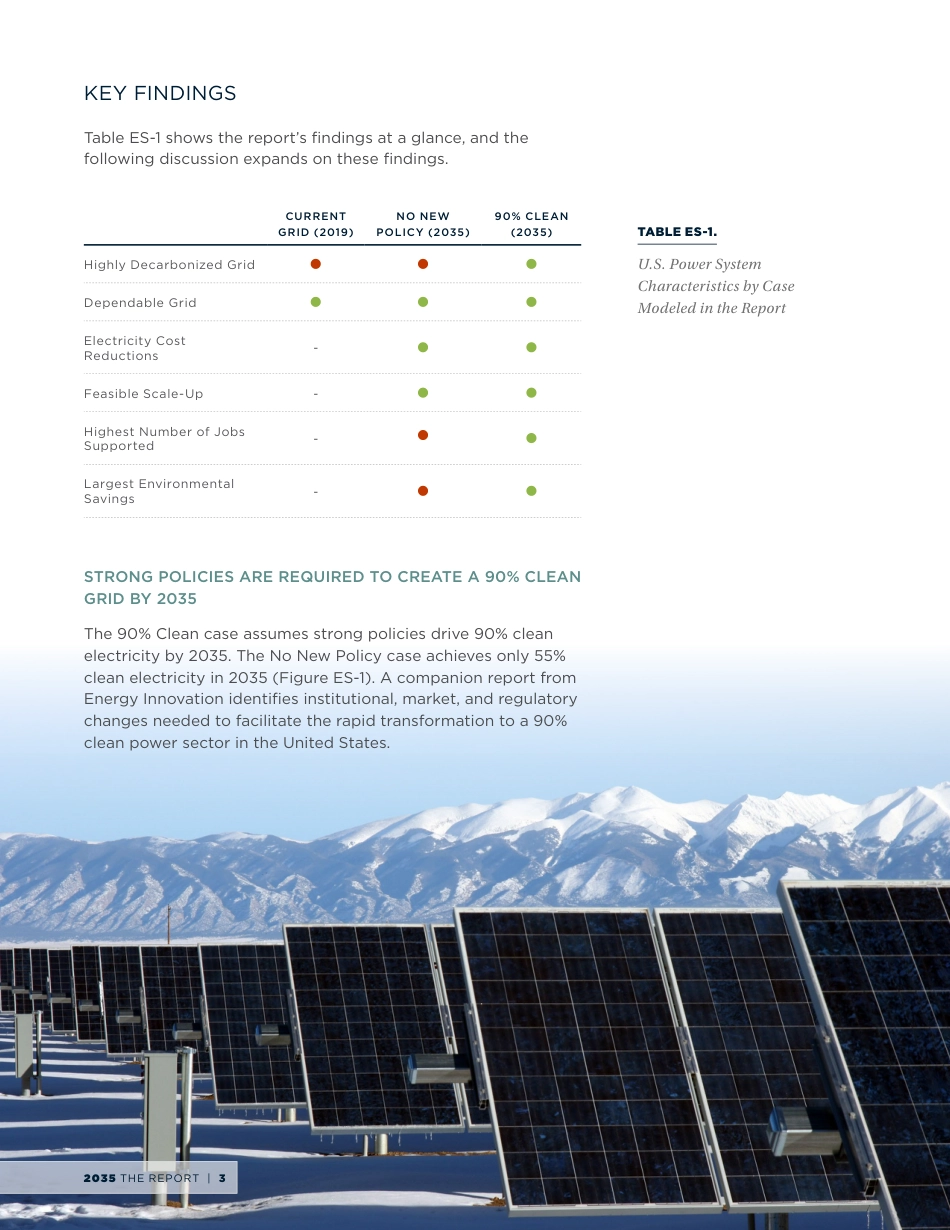
PLUMMETING
SOLAR, WIND, AND
BATTERY COSTS CAN
ACCELERATE OUR
CLEAN ELECTRICITY
FUTURE
JUNE 2020
Global carbon emissions must be halved by 2030 to limit
warming to 1.5°C and avoid catastrophic climate impacts. Most
existing studies, however, examine 2050 as the year that deep
decarbonization of electric power systems can be achieved—a
timeline that would also hinder decarbonization of the buildings,
industrial, and transportation sectors.
In light of recent trends, these studies present overly conservative
estimates of decarbonization potential. Plummeting costs for wind
and solar energy have dramatically changed the prospects for
rapid, cost-eective expansion of renewable energy. At the same
time, battery energy storage has become a viable option for cost-
eectively integrating high levels of wind and solar generation into
electricity grids.
This report uses the latest renewable energy and battery cost data
to demonstrate the technical and economic feasibility of achieving
90% clean (carbon-free) electricity in the United States by 2035.
Two central cases are simulated using state-of-the-art capacity-
expansion and production-cost models: The No New Policy case
assumes continuation of current state and federal policies; and
the 90% Clean case requires that a 90% clean electricity share is
reached by 2035.
EXECUTIVE
SUMMARY
2035 THE REPORT | 2
KEY FINDINGS
Table ES-1 shows the report’s findings at a glance, and the
following discussion expands on these findings.
CURRENT
GRID (2019)
NO NEW
POLICY (2035)
90% CLEAN
(2035)
Highly Decarbonized Grid
Dependable Grid
Electricity Cost
Reductions -
Feasible Scale-Up -
Highest Number of Jobs
Supported -
Largest Environmental
Savings -
STRONG POLICIES ARE REQUIRED TO CREATE A 90% CLEAN
GRID BY 2035
The 90% Clean case assumes strong policies drive 90% clean
electricity by 2035. The No New Policy case achieves only 55%
clean electricity in 2035 (Figure ES-1). A companion report from
Energy Innovation identifies institutional, market, and regulatory
changes needed to facilitate the rapid transformation to a 90%
clean power sector in the United States.
TABLE ES-1.
U.S. Power System
Characteristics by Case
Modeled in the Report
2035 THE REPORT | 3
PLUMMETINGSOLAR,WIND,ANDBATTERYCOSTSCANACCELERATEOURCLEANELECTRICITYFUTUREJUNE2020Globalcarbonemissionsmustbehalvedby2030tolimitwarmingto1.5°Candavoidcatastrophicclimateimpacts.Mostexistingstudies,however,examine2050astheyearthatdeepdecarbonizationofelectricpowersystemscanbeachieved—atimelinethatwouldalsohinderdecarbonizationofthebuildings,industrial,andtransportationsectors.Inlightofrecenttrends,thesestudiespresentoverlyconservativeestimatesofdecarbonizationpotential.Plummetingcostsforwindandsolarenergyhavedramaticallychangedtheprospectsforrapid,cost-effectiveexpansionofrenewableenergy.Atthesametime,batteryenergystoragehasbecomeaviableoptionforcost-effectivelyintegratinghighlevelsofwindandsolargenerationintoelectricitygrids.Thisreportusesthelatestrenewableenergyandbatterycostdatatodemonstratethetechnicalandeconomicfeasibilityofachieving90%clean(carbon-free)electricityintheUnitedStatesby2035.Twocentralcasesaresimulatedusingstate-of-the-artcapacity-expansionandproduction-costmodels:TheNoNewPolicycaseassumescontinuationofcurrentstateandfederalpolicies;andthe90%Cleancaserequiresthata90%cleanelectricityshareisreachedby2035.EXECUTIVESUMMARY2035THEREPORT2KEYFINDINGSTableES-1showsthereport’sfindingsataglance,andthefollowingdiscussionexpandsonthesefindings.CURRENTGRID(2019)NONEWPOLICY(2035)90%CLEAN(2035)HighlyDecarbonizedGridDependableGridElectricityCostReductions-FeasibleScale-Up-HighestNumberofJobsSupported-LargestEnvironmentalSavings-STRONGPOLICIESAREREQUIREDTOCREATEA90%CLEANGRIDBY2035The90%Cleancaseassumesstrongpoliciesdrive90%cleanelectricityby2035.TheNoNewPolicycaseachievesonly55%cleanelectricityin2035(FigureES-1).AcompanionreportfromEnergyInnovationidentifiesinstitutional,market,andregulatorychangesneededtofacilitatetherapidtransformationtoa90%cleanpowersectorintheUnitedStates.TABLEES-1.U.S.PowerSystemCharacteristicsbyCaseModeledintheReport2035THEREPORT3THE90%CLEANGRIDISDEPENDABLEWITHOUTCOALPLANTSORNEWNATURALGASPLANTSRetainingexistinghydropowerandnuclearcapacity(afteraccountingforplannedretirements),andmuchoftheexistingnaturalgascapacitycombinedwithnewbatterystorage,issufficienttomeetU.S.electricitydemanddependably(i.e.,everyhouroftheyear)witha90%cleangridin2035.Underthe90%Cleancase,allexistingcoalplantsareretiredby2035,andnonewfossilfuelplantsarebuilt.Duringnormalperiodsofgenerationanddemand,wind,solar,andbatteriesprovide70%ofannualgeneration,whilehydropowerandnuclearprovide20%.Duringperiodsofveryhighdemandand/orverylowrenewablegeneration,existingnaturalgas,hydropower,andnuclearplantscombinedwithbatterystoragecost-effectivelycompensateformismatchesbetweendemandandwind/solargeneration.Generationfromnaturalgasplantsconstitutesabout10%oftotalannualelectricitygeneration,whichisabout70%lowerthantheirgenerationin2019.ELECTRICITYCOSTSFROMTHE90%CLEANGRIDARELOWERTHANTODAY’SCOSTSWholesaleelectricitycosts,whichincludethecostofgenerationplusincrementaltransmissioninvestments,areabout10%lowerin2035underthe90%Cleancasethantheyaretoday,mainlyowingtolowrenewableenergyandbatterycosts(FigureES-2).Pervasivenessoflow-costrenewableenergyandbatterystorageacrosstheUnitedStatesrequiresinvestmentmainlyintransmissionspursconnectingrenewablegenerationtoexistingFIGUREES-1.GenerationMixesforthe90%CleanCase(left)andNoNewPolicyCase(right),2020–2035500040003000200010000ANNUALGENERATION90%CLEANANNUALGENERATION(TWh/yr)COALGASNUCLEARWINDHYDROOTHERGEOTHERMALBIOPOWERSOLAR500040003000200010000ANNUALGENERATION(TWh/yr)COALGASNUCLEARWINDHYDROOTHERGEOTHERMALBIOPOWERSOLARANNUALGENERATIONNONEWPOLICY202O202520302035202O2025203020352035THEREPORT4high-capacitytransmissionlinesorloadcenters.Hence,additionaltransmission-relatedcostsandsitingconflictsaremodest.Relyingonnaturalgasforonly10%ofgenerationavoidslargeinvestmentsforinfrequentlyusedcapacity,helpingtoavoidmajornewstranded-assetcosts.Retainingnaturalgasgenerationavertstheneedtobuildexcessrenewableenergyandlong-durationstoragecapacity—helpingachieve90%cleanelectricitywhilekeepingcostsdown.Whilestilllowerthantoday’scosts,wholesaleelectricitycostsare12%higherunderthe90%CleancasethanundertheNoNewPolicycasein2035.However,thiscomparisondoesnotaccountforthevalueofemissionsreductionsorjobcreationunderthe90%Cleancase.80706050403020100202O202520302035202O202520302035$/MWh(2018REAL)$/MWh(2018REAL)90%CLEANW/ENVCOSTNONEWPOLICYW/ENVCOST80706050403020100NONEWPOLICYW/OENVCOST90%CLEANW/OENVCOSTTHE90%CLEANGRIDAVOIDS$1.2TRILLIONINHEALTHANDENVIRONMENTALDAMAGES,INCLUDING85,000PREMATUREDEATHS,THROUGH2050The90%CleancasenearlyeliminatesemissionsfromtheU.S.powersectorby2035,resultinginenvironmentalandhealthbenefitslargelydrivenbyreducedmortalityrelatedtoelectricitygeneration(FigureES-3).ComparedwiththeNoNewPolicycase,the90%Cleancasereducescarbondioxide(CO2)emissionsby88%by2035.Italsoreducesexposuretofineparticulate(PM2.5)matterbyreducingnitrogenoxide(NOx)andsulfurdioxide(SO2)emissionsby96%and99%,respectively.1Asaresult,the90%Cleancaseavoidsover$1.2trillioninhealthandenvironmentalcosts,including85,000avoidedprematuredeaths,through2050.Thesesavingsequateroughlyto2cents/kWhofwholesale1PrimaryPM2.5emissionsreductionsarenotestimatedbythemodel,resultinginaconservativeestimateofreducedPM2.5exposure.FIGUREES-2.WholesaleElectricityCostswith(left)andwithout(right)EnvironmentalCosts,forthe90%CleanandNoNewPolicyCases2035THEREPORT5electricitycosts,whichmakesthe90%Cleancasethelowest-net-costoptionwhenenvironmentalandhealthcostsareconsidered.FIGUREES-3.EmissionsofCO2,SO2,andNOxinthe90%CleanandNoNewPolicyCases,2020–203520001800160014001200100080060040020002020202520302035MILLIONTONS/YR90%CLEANNONEWPOLICYCO2EMISSIONS(MILLIONTONS/YR)1.21.00.80.60.40.20.0202020252030203590%CLEANNONEWPOLICYSO2EMISSIONS(MILLIONTONS/YR)MILLIONTONS/YR1.21.00.80.60.40.20.02020202520302035NONEWPOLICYNOXEMISSIONS(MILLIONTONS/YR)90%CLEANMILLIONTONS/YRSCALING-UPRENEWABLESTOACHIEVE90%CLEANENERGYBY2035ISFEASIBLEToachievethe90%Cleancaseby2035,1,100GWofnewwindandsolargenerationmustbebuilt,averagingabout70GWperyear(FigureES-4).RecentU.S.precedentsfornaturalgasandwind/solarexpansionsuggestthatarenewableenergybuildoutofthismagnitudeischallengingbutfeasible.Newrenewableresourcescanbebuiltcost-effectivelyinallregionsofthecountry.2035THEREPORT6FIGUREES-4.CumulativeNewCapacityAdditionsinthe90%CleanCase,2020–20351400120010008006004002000CUMULATIVENEWCAPACITYADDITIONSNEWCAPACITY(GW)BatteryStorageSolarWind202O202520302035THE90%CLEANGRIDCANSIGNIFICANTLYINCREASEENERGY-SECTOREMPLOYMENTThe90%Cleancasesupportsatotalof29millionjob-yearscumulativelyduring2020–2035.Employmentrelatedtotheenergysectorincreasesbyapproximately8.5millionnetjob-years,asincreasedemploymentfromexpandingrenewableenergyandbatterystoragemorethanreplaceslostemploymentrelatedtodecliningfossilfuelgeneration.TheNoNewPolicycaserequiresone-thirdfewerjobs,foratotalof20millionjob-yearsoverthestudyperiod.Thesejobsincludedirect,indirect,andinducedjobsrelatedtoconstruction,manufacturing,operationsandmaintenance,andthesupplychain.Overall,the90%Cleancasesupportsover500,000morejobseachyearcomparedtotheNoNewPolicycase.ACCELERATINGTHECLEANENERGYFUTUREEstablishingatargetyearof2035,ratherthanthetypical2050target,helpsalignexpectationsforpower-sectordecarbonizationwithclimaterealitieswhileinformingthepolicydialogueneededtoachievesuchanambitiousgoal.Aimingfor90%cleanelectricity—ratherthan100%—by2035isalsoimportantforenvisioningrapid,cost-effectivedecarbonization.By2035,emergingtechnologiessuchasfirm,low-carbonpowershouldbematureenoughtobegintoreplacetheremainingnaturalgasgenerationasthenationacceleratestoward100%,cross-sectordecarbonization.Reaching90%zero-carbonelectricityintheUnitedStatesby2035wouldcontributea27%reductionineconomy-widecarbonemissionsfrom2010levels.2035THEREPORT7ExecutiveSummary21.Introduction122.MethodsandDataSummary133.KeyFindings163.1StrongPoliciesAreRequiredtoCreatea90%CleanGridby2035163.2The90%CleanGridIsDependablewithoutCoalPlantsorNewNaturalGasPlants173.3ElectricityCostsfromthe90%CleanGridAreLowerthanToday’sCosts223.4Scaling-UpRenewablestoAchieve90%CleanEnergyby2035IsFeasible273.5The90%CleanGridCanSignificantlyIncreaseEnergy-SectorEmployment283.6The90%CleanGridAvoids$1.2TrillioninHealthandEnvironmentalDamages,Including85,000PrematureDeaths,Through2050304.CaveatsandFutureWork34References36TABLEOFCONENTSFundingwasprovidedbytheMacArthurFoundation.NAMESANDAFFILIATIONSOFAUTHORSANDTECHNICALREVIEWCOMMITTEEAmolPhadke,1UmedPaliwal,1NikitAbhyankar,1TaylorMcNair,2BenPaulos,3DavidWooley,1RicO’Connell21GoldmanSchoolofPublicPolicy,UniversityofCaliforniaBerkeley,2GridLab,3PaulosAnalysis.CorrespondingAuthorsBelowarethemembersoftheTechnicalReviewCommittee(TRC).TheTRCprovidedinputandguidancerelatedtostudydesignandevaluation,butthecontentsandconclusionsofthereport,includinganyerrorsandomissions,arethesoleresponsibilityoftheauthors.TRCmemberaffiliationsinnowayimplythatthoseorganizationssupportorendorsethisworkinanyway.SoniaAggarwal,EnergyInnovationMarkAhlstrom,EnergySystemsIntegrationGroupSteveBeuning,HolyCrossEnergyAaronBloom,EnergySystemsIntegrationGroupSeverinBorenstein,HaasSchoolofBusiness,UniversityofCaliforniaBerkeleyBenHobbs,JohnsHopkinsUniversityAidanTuohy,ElectricPowerResearchInstituteACKNOWLEDGEMENTSThefollowingpeopleprovidedinvaluabletechnicalsupport,input,andassistanceinmakingthisreportpossible.PhoebeSweet,CourtneySt.John,ChelseaEakin,LindsayHamilton,ClimateNexusSilvioMarcacci,EnergyInnovationJarettZuboy,independentcontractorBetonyJones,InclusiveEconomicsSimoneCobb,GoldmanSchoolofPublicPolicy,UniversityofCaliforniaBerkeleyManinderThindandJulianMarshall,UniversityofWashingtonYinongSun,NationalRenewableEnergyLaboratoryZaneSelvans,CatalystCooperativeWearethankfultotheNationalRenewableEnergyLaboratoryformakingitsReEDSmodelpubliclyavailable,aswellasalltheirscenariosandtheAnnualTechnologyBaseline.Appendices,supportingreports,anddatavisualizationscanbefoundat2035report.com2035THEREPORT9ABOUTGRIDLABGridLabisaninnovativenon-profitthatprovidestechnicalgridexpertisetoenhancepolicydecision-makingandtoensurearapidtransitiontoareliable,cost-effective,andlow-carbonfuture.ABOUTUNIVERSITYOFCALIFORNIABERKELEYGOLDMANSCHOOLOFPUBLICPOLICYTheCenterforEnvironmentalPublicPolicy,housedatUCBerkeley’sGoldmanSchoolofPublicPolicy,takesanintegratedapproachtosolvingenvironmentalproblemsandsupportsthecreationandimplementationofpublicpoliciesbasedonexactinganalyticalstandardsthatcarefullydefineproblemsandmatchthemwiththemostimpactfulsolutions.InOctober2018,theU.N.IntergovernmentalPanelonClimateChange(IPCC)reportedthatglobalcarbonemissionsmustbehalvedby2030tolimitwarmingto1.5°Candavoidcatastrophicclimateimpacts(UNIPCC2018).Mostexistingstudies,however,examine2050astheyearthatdeepdecarbonizationofelectricpowersystemscanbeachieved—atimelinethatwouldalsohinderdecarbonizationofthebuildings,industrial,andtransportationsectorsthroughelectrification.2Thesestudiesofferlittlehopethatclimatechangeimpactscanbeheldtoamanageablelevelinthiscentury.Yet,inlightofrecenttrends,thesestudies—eventhosepublishedinthepastfewyears—presentoverlyconservativeestimatesofdecarbonizationpotential.Plummetingcostsandcostprojectionsforwindandsolarenergyhavedramaticallychangedtheprospectsforrapid,cost-effectivedecarbonization(Figure1).Atthesametime,batteryenergystoragehasbecomeaviableoptionforcost-effectivelyintegratinghighlevelsofwindandsolargenerationintoelectricitygrids.605040302010010090807060504030201002010201020202020203020302040204020502050$/MWH(2018REAL)WINDLCOE,BESTCAPACITYFACTORATBLOWCASESOLARPVLCOE,BESTCAPACITYFACTORATBLOWCASEATB2015ATB2015ATB2016ATB2016ATB2017ATB2017ATB2019ATB2019ATB2018ATB20182Broadly,thesestudiesdonotassessnear-completepower-sectordecarbonization(80%decarbonizationorgreater)before2050.Theonestudy(MacDonaldetal.2016)thatassessescompletedecarbonizationoftheU.S.powersectorby2030doesnotassumeasignificantroleforbatterystorage,asourreportdoes.Instead,itreliesonexpansionoftheU.S.transmissionnetwork,whichistechnicallyandeconomicallychallenging(Joskow2004).SeeAppendix1forabriefreviewofsomeofthesestudies.1INTRODUCTIONFIGURE1.NationalRenewableEnergyLaboratory(NREL)AnnualTechnologyBaseline(ATB)Low-CaseCostProjectionsMade2015–2019forYearsThrough2050Wind(left)andsolarphotovoltaic(PV,right)levelizedcostofelectricity(LCOE)projectionsareshownbytheyearthateachprojectionwasmadeintheNRELATB(NREL2015;2016;2017;2018;2019)usingATBlow-caseassumptionsandbestcapacityfactors.LCOEprojectionswerereviseddownwardsinalmosteveryyearduringthisperiod.$/MWH(2018REAL)Thisreportusesthelatestrenewableenergyandbatterycostinformationtodemonstratethetechnicalandeconomicfeasibilityofachieving90%“clean”electricityintheUnitedStatesby2035—muchmorequicklythanprojectedbymostrecentstudies.Generationfromanyresourcethatdoesnotproducedirectcarbondioxide(CO2)emissionsisconsideredcleaninthisanalysis,includinggenerationfromnuclear,hydropower,wind,solar,3biomass,andfossilfuelplantswithcarboncaptureandstorage.Considerationoftheaccelerated2035timeframehelpsalignexpectationsforpower-sectordecarbonizationwithclimaterealitieswhileinformingthepolicydialogueneededtoachievesuchanambitiousgoal.Thisreport’stargetof90%cleanelectricity(ratherthan100%)by2035isalsoimportantforenvisioningdecarbonizationatapacemorerapidthanconsideredinpreviousstudies.Achievingalmost-completepowersectordecarbonizationin2035mayultimatelyincreasethespeedandcost-effectivenessofpervasive,cross-sectordecarbonization.Afterabriefdescriptionofmethodsanddata,thekeyfindingsofthe2035decarbonizationreportaresummarized.Thereport’sappendicesprovidedetailsoftheanalysesandresults.AcompanionreportfromEnergyInnovationidentifiesinstitutional,market,andregulatorychangesneededtofacilitatetherapidtransformationtoa90%cleanpowersectorintheUnitedStates(EnergyInnovation2020).Weperformedpower-sectormodelinginconsultationwithatechnicalreviewcommitteeconsistingofexpertsfromutilities,universities,andthinktanks.Weemployedstate-of-the-artmodels,includingNREL’sRegionalEnergyDeploymentSystem(ReEDS)capacity-expansionmodelandEnergyExemplar’sPLEXOSelectricityproduction-costmodel,inconjunctionwithpubliclyavailablegenerationandtransmissiondatasets.Forecastsofrenewableenergyandbatterycostreductionswere3Theterms“solar”and“PV”areusedinterchangeablyinthisreport,becauseessentiallyallthesolardeployedinthesimulationsisPV;theconcentratingsolarpowerdeploymentisnegligible.2METHODSANDDATASUMMARY2035THEREPORT12basedonNREL’sATB2019(NREL2019).4Weusedthesedataandmethodstoanalyzetwocentralcases:•NoNewPolicy:Assumescurrentstateandfederalpoliciesandforecastedtrendsintechnologycosts.5•90%Clean:Requiresanational90%cleanelectricityshareby2035.Weanalyzedthesensitivityofthe90%Cleancasetoperiodsofextraordinarilylowrenewableenergygenerationand/orhighdemand,toensurethatasystemwith90%renewableenergysupplymeetsdemandineveryhour.Toassesssystemdependability,definedastheabilitytomeetpowerdemandineveryhouroftheyear,wesimulatedhourlyoperationoftheU.S.powersystemover60,000hours(eachhourin7weatheryears).Foreachofthesehours,weconfirmedthatelectricitydemandismetineachofthe134regionalzones(subpartsoftheU.S.powersystemrepresentedinthemodel)whileabidingbyseveraltechnicalconstraints(suchasrampratesandminimumgeneration)formorethan15,000individualgeneratorsand310transmissionlines.Furtherworkisneededtoassessissuessuchastheeffectofthe90%Cleancaseonlossofloadprobability,systeminertia,andalternating-currenttransmissionflows.Wealsoconsideredthreeprimarysetsoffuturerenewableenergyandbatterystoragecostassumptions(Figure2;seeAppendix2forin-depthcostanalyses):•Low-Cost:NRELATBlow-caseassumptions,assuming40%to50%costreductionsforPV,wind,andstorageby2035(comparedwith2020).•Base-Cost:modifiedNRELATBmid-caseassumptions,assuming2021costsbeginattheATBlow-caseassumptions,butpost-2021costreductionsareinlinewiththeATBmid-case.•High-Cost:NRELATBmid-caseassumptions,includingassumed2020coststhatarehigherthanactual2020costs.Appendix3detailsouradditionalscenarioandsensitivityanalyses,includingacasethatseekstointernalizethesocietalcostsofCO2emissions.WealsoevaluatedtheimpactofelectrificationusingthehighelectrificationcasefromtheNRELElectrificationFuturesStudy2018(Mai2018).4Thecostreductionsdetailedinthisreportreferprimarilytoutility-scalePV,wind,andbatterystorage.DistributedPVisconsideredinthisanalysis,servingasaninputtotheReEDSmodelbasedonNRELmodelingassumptions.In2035,underthe90%Cleancase,thereareapproximately60GWofdistributedPV,representingapproximately2%oftotalenergygeneration.Fordetailontherenewablecapacitybreakdown,seeAppendix3.5ReEDSconsidersrelevantstateandfederalpolicies,suchasstateRenewablePortfolioStandards,asofearly2019.2035THEREPORT13$/MWH(2018REAL)1009080706050403020100201020152020202520302035$/MWH(2018REAL)WINDLCOEHISTORICALPPAPRICE(UNSUBSIDIZED)HIGH-COSTLOW-COSTBASE-COST300250200150100500201020152020202520302035SOLARLCOEHISTORICALPPAPRICE(UNSUBSIDIZED)HIGH-COSTLOW-COSTBASE-COSTCAPITALCOST$/KWH(2018REAL)1400120010008006004002000201020152020202520302035BATTERYSTORAGECAPITALCOSTHISTORICALCAPITALCOST(UNSUBSIDIZED)HIGH-COSTLOW-COSTBASE-COSTWetestedtherobustnessofourfindingsthroughsensitivityanalysesofthekeyinputassumptionsusedinthisreport,includingsensitivitiesaroundtechnologycosts,financingcosts,andnaturalgasprices.Weconsideredthreeprimarysetsoffuturerenewableenergyandbatterystoragetechnologycosts(describedabove),twosetsoffinancingcosts,andtwosetsofnaturalgasprices.ThebasecasefinancingcostscorrespondtotheassumptionsusedinNREL(2019)andareinlinewithtoday’sfinancingcosts.Thehighfinancingcostsassumethatthecostofcapital(real)istwicethecostassumedinthebasecase.ThebasecasenaturalgaspricesarethesameasinthereferencecaseintheU.S.EnergyInformationAdministration(EIA)AnnualEnergyOutlook(EIA2020a).ThelownaturalgaspricesuseNewYorkMercantileExchange(NYMEX)futurepricesuntil2023,andbeyond2023thepriceofnaturalgasiskeptconstantat$2.50/MMbtu(nominal),withafloorof$1.50/MMbtu(2018real).WeevaluateallpermutationsoftheseassumptionsfortheNoNewPolicyand90%Cleancases(24casesintotal).RefertoAppendix3forfurthersensitivityanalyses.Weusedtheindustry-standardIMPLANmodeltoestimatethejoblossesandgainsassociatedwitheachofourcases.WeusedReEDStoestimateemissions—CO2aswellassulfurdioxide(SO2)andnitrogenoxides(NOx)—associatedwithpowergenerationbasedonemissionfactorsforeachgenerationtechnology.WeusedestimatesofthesocialcostofcarbonanddamagesassociatedwithSO2andNOxfromtheliterature(asdollarsandprematuredeathspermetrictonofpollutant)toestimatetheenvironmentaldamagesassociatedwitheachcase.ResultsandassumptionsarediscussedbelowandinAppendix2.FIGURE2.HistoricalandProjectedTechnologyCostDeclinesonWhichOurAnalysesWereBasedForsolarandwind,thehistoricalLCOEwasestimatedbyadjustinghistoricalpower-purchaseagreement(PPA)pricesforsubsidies(investmenttaxcreditandproductiontaxcredit).PPApricedatawereobtainedfromLawrenceBerkeleyNationalLaboratory’sutility-scalesolar(Bolingeretal.2019a,2019b)andwind(WiserandBolinger2019)reports.Forfour-hourbatteries,historicalpackcostswerebasedonBloombergNewEnergyFinancedata(Goldie-Scot2019),andbalance-of-systemcostdatawerefromNREL(2018a).FuturecostprojectionsforallthreetechnologieswerebasedonNREL(2019).2035THEREPORT14Thissectionhighlightsthekeyfindingsfromouranalysis.Additionaldetailsareprovidedintheappendices.3.1STRONGPOLICIESAREREQUIREDTOCREATEA90%CLEANGRIDBY2035Inour90%Cleancase,werequirea90%cleanelectricityshareby2035;thatis,wesetthe2035gridmixtobe90%clean.Inthisanalysis,cleangenerationreferstoresourcesthatproducenodirectCO2emissions,includinghydropower,nuclear,wind,PV,andbiomass.IntheNoNewPolicycase,however,thegridmixisdeterminedbyleast-costcapacity-expansionmodelingbasedonthecurrentparadigmforelectricity-marketcosts,whichdoesnotfullyinternalizethecostsofenvironmentalandhealthdamagesfromfossilfueluse.Asaresult,cleangeneratorsonlysupply55%oftheelectricityintheNoNewPolicycasein2035.Figure3comparesthegridmixesinthetwocases.The2035gridmixfromEIA’sAnnualEnergyOutlookReferenceCaseissimilar(47%cleangeneration)tothe2035mixintheNoNewPolicycase(EIA2020a).3KEYFINDINGSFIGURE3.GenerationMixesforthe90%CleanCase(left)andNoNewPolicyCase(right),2020–2035500040003000200010000ANNUALGENERATION90%CLEANANNUALGENERATION(TWh/yr)COALGASNUCLEARWINDHYDROOTHERGEOTHERMALBIOPOWERSOLAR500040003000200010000ANNUALGENERATION(TWh/yr)COALGASNUCLEARWINDHYDROOTHERGEOTHERMALBIOPOWERSOLARANNUALGENERATIONNONEWPOLICY202O202520302035202O2025203020352035THEREPORT15The90%Cleancaseassumesimplementationofpoliciesthatpromotelarge-scalerenewableenergyadoptionandyieldnetsocietalbenefitscomparedwiththebusiness-as-usualapproachassumedundertheNoNewPolicycase.AsdetailedinSections3.3and3.6,thenominalelectricitycostincreasesunderthe90%Cleancasearemorethanoffsetbythesocietalbenefitsprovidedbythatcase.3.2THE90%CLEANGRIDISDEPENDABLEWITHOUTCOALPLANTSORNEWNATURALGASPLANTSGiventhedramaticdeclineinbatterystorageprices,wefindthatsignificantshort-durationstorageiscost-effectiveandplaysacriticalloadinbalancingthegrid.Weestimatethatabout600GWh(150GWfor4hours)ofstoragecost-effectivelysupportsgridoperationsinthe90%Cleancase,representingabout20%ofdailyelectricitydemand.6Whenrenewableenergygenerationexceedsdemand,storagecanchargeusingthisotherwise-curtailedelectricityandthendispatchelectricityduringperiodswhenrenewablegenerationfallsshortofdemand.Despitetheadditionofstorage,about14%ofavailablerenewableenergymustbecurtailedannually.Newlong-durationstoragetechnologiesmightreducecurtailmentfurther.Toestimatethegenerationcapacityrequiredtomeetsystemdemandineveryhour,evenduringperiodsoflowrenewableenergygenerationand/orhighdemand,wesimulatehourlyoperationoftheU.S.powersystemformorethan60,000hours(eachhourin7weatheryears).Foreachofthesehours,weevaluateandconfirmhowelectricitydemandismetineachofthe134regionalzones(subpartsoftheU.S.powersystemrepresentedinthemodel)whileabidingbyseveraltechnicalconstraints(suchasrampratesandminimumgeneration)formorethan15,000individualgeneratorsand310transmissionlines.Duringthe7weatheryears,wefindsignificantvariationinwindandsolargeneration.Duringthehouroflowestwindandsolargeneration,totalwindandsolargenerationis94%belowratedcapacity(about75GWofgenerationfrom1,220GWofcapacity)and80%belowtheyearlyaverageofwindandsolargeneration.Solargenerationdropstozeroinnighttimehours,whereasthelowesthourlyperiodofwindgenerationisabout90%below6Becauseofmodelinglimitations,weonlyconsidera4-hourstoragedurationinthisanalysis.2035THEREPORT16average.Thedeclineinwindandsolargenerationoverdaysandweeksisprogressivelylower(Figure4).0%20%40%60%80%100%HIGHESTDROPINWIND/SOLARGENERATION(%OFAVERAGE)WEEKDAYHOURWind+SolarWindSolarTohighlightthedependabilityofa90%cleanelectricitygridandestimatenaturalgascapacityrequirements,weidentifytheperiodduringthe7weatheryearswhenmaximumnaturalgasgenerationcapacityisneededtocompensateforthelargestgapbetweencleanelectricitygeneration(includingbatterygeneration)andload.Themaximumnaturalgascapacityrequiredisabout360GWonAugust1inoneoftheweatheryears(2007)(Figure5).At8:00pmEasternTimeonthatday,solargenerationdeclinestolessthan10%ofinstalledsolarcapacity,whilewindgenerationis18%belowinstalledwindcapacity,resultinginonlyabout150GWofwindandsolarproduction(about55%belowtheannualaverage,asindicatedinFigures6and7).Thetotalsystemdemandofabout735GWismetbyacombinationofothercleanresources,suchashydropowerandnuclear,approximately360GWofnaturalgas,and80GWofbatterydischarge(Figure8).FIGURE4.MaximumDropinWindandSolarOutputRelativetoAverageWindandSolarGeneration2035THEREPORT17HOURLYGENERATION(GW)8006004002000-20029/JULY30/JULY31/JUL1/AUG2/AUG3/AUG4/AUGNUCLEARBATTERYLOADPUMPED-HYDROLOADGASHYDROBATTERYDISCHARGEWINDSOLARLOADHOURLYDISPATCHDURINGTHEMAXGASGENERATIONWEEKFIGURE5.HourlyU.S.Power-SystemDispatchforExtremeWeatherDaysinthe90%CleanCasein2035Figure5detailsthedispatchfortheperiodofmaximumnaturalgasgeneration,oneweekinlateJulyandearlyAugust.Approximately360GWofnaturalgasisdispatchedtomeetdemandonAugust1,whilerenewablescontributesignificantlylessgenerationthannormal.Evenwhenwindandsolargenerationdropstolowlevels,existinghydropower,nuclearpower,andnaturalgascapacity,aswellasnewbatterystorage,aresufficienttomaintainsystemoperations.HOURLYGENERATION(GW)8007006005004003002001000-100123456789101112131415161718192021222324NUCLEARBATTERYLOADGASBATTERYDISCHARGEHYDROWINDSOLARLOADCURTAILMENTPUMPED-HYDROLOADFIGURE6.HourlyU.S.Power-SystemDispatchforanAverageWeatherDayinthe90%CleanCasein2035Figure6detailstheannualaveragegenerationstackforeachhourofanaverageweatherday.Windandsolarprovidealargeshareofnighttimeanddaytimegeneration,respectively,andbroadlycomplementeachother.Batterystorageisprimarilydispatchedduringeveninghourswhensolargenerationdropsandloadremainsrelativelyhigh.2035THEREPORT18Forallweatheryears,thenaturalgascapacityrequirementsarehighestinAugust,whenwindgenerationfallssignificantly(Figures7and8).Naturalgasgenerationabove300GWisrequiredforfewerthan45hoursperyearoverthe7-weather-yearsimulation.Ofthe360GWofnaturalgasdispatchin2035underthe90%Cleancase,70GWhasacapacityfactorbelow1%.Othertechnologyalternativesnotconsideredinthisanalysis,suchasdemandresponse,energyefficiency,orflexibleload,maybemorecost-effectiveforsystembalancinginthosehours.WealsofindthatincreasedelectrificationoftheU.S.economyreducestheamountofbatterystoragerequired,andresultsinslightlylowerwholesalepowercoststhanthe90%CleanCase(seeAppendix3).DAILYENERGY(TWH/DAY)20181614121086420-2NUCLEARBATTERYLOADPUMPED-HYDROLOADGASHYDROBATTERYDISCHARGEWINDSOLARLOADCURTAILMENTDAILYENERGYBALANCEJAN2035FEB2035MAR2035APR2035MAY2035JUN2035JUL2035AUG2035SEP2035OCT2035NOV2035DEC2035TOTALGASGENERATIONIN2035(GW)4003002001000GASGENERATIONIN2035FORSEVENWEATHERYEARSJAN/O7JAN/O8JAN/O9JAN/10JAN/11JAN/12JAN/13JUL/O7JUL/O8JUL/O9JUL/10JUL/11JUL/12JUL/13FIGURE8.HourlyU.S.NaturalGasDispatchover7WeatherYearsinthe90%CleanCasein2035Figure8detailsthehourlynaturalgasgenerationin2035for7weatheryears.Themaximumnaturalgasgenerationrequiredis360GW.FIGURE7.DailyU.S.PowerSystemDispatchAveragedOver7WeatherYearsinthe90%CleanCasein20352035THEREPORT19Therenewableenergyvariationweobserveoverthe7-yearperiodissimilartothevariationobservedovera35-yearperiodbyShaneretal.(2018),althoughtheymayunderestimatethevariationinwindgenerationcomparedtothatseeninourdata,asShaneretal.considerssignificantlylowerspatialresolutionthanourstudy.Ouranalysisdoesnotconsider35weatheryearsowingtolackofdata.Further,oursimulationincludesadequatenaturalgasandbatterystoragecapacitytomeetresidualload(loadminuscleanenergygeneration)thatisupto113%ofaverageloadand70%ofpeakload.Hence,evenifalongerperiodofweatherdatarevealslargergapsbetweenloadandwind/solargeneration,additionalfirmcapacityrequirementsareunlikelytobesignificant.However,furtherworkisneededtoassessthispossibility.Insummary,retainingexistinghydropowercapacityandnuclearpowercapacity(afteraccountingforplannedretirements)andabouthalfofexistingfossilfuelcapacity,combinedwith150GWofnew4-hourbatterystorage,issufficienttomeetU.S.electricitydemandwitha90%cleangridin2035,evenduringperiodsoflowrenewableenergygenerationand/orhighdemand.Underthe90%Cleancase,allexistingcoalplantsareretiredby2035,andnonewfossilfuelplantsarebuiltbeyondthosealreadyunderconstruction.Duringnormalperiodsofgenerationanddemand,wind,solar,andbatteriesprovide70%oftotalannualgeneration,whilehydropowerandnuclearprovide20%.Duringperiodsofhighdemandand/orlowrenewablegeneration,existingnaturalgasplants(primarilycombined-cycleplants)cost-effectivelycompensateforremainingmismatchesbetweendemandandrenewables-plus-batterygeneration—accountingforabout10%oftotalannualelectricitygeneration,whichisabout70%lowerthantheirgenerationin2019.Althoughthecapacity-expansionmodeling(ReEDS)requiredthatcleanresourcescontribute90%ofannualgenerationin2035,thehourlyoperationalmodel(PLEXOS)simulatedroughly85%cleangeneration,primarilyduetohighercurtailmentofwindandsolar.PLEXOSmodeldispatchdecisionswerebasedonthevariablecostofgenerationanddidnotconsiderthecarbonfreeornon-carbonfreenatureofthegenerationsource.Inanelectricitymarketwitha90%cleanenergyconstraint,asmodeledinour90%CleanCase,cleanenergymaybidnegativepricesincertainhoursinordertogetdispatchedandmeetthe90%constraint.WeutilizeReEDStoeffectivelymodelthis90%cleanelectricityshare,whilethemainpurposeofoursimulationinPLEXOSistoevaluateoperationalfeasibility.Forthisreason,wedidnotsimulatethesame90%cleanenergyconstraintin2035THEREPORT20PLEXOS,whichmighthaverequiredcleanenergytobidnegativepricesinordertogetdispatched.7Ourmodelingapproachrepresentsaconservativestrategyforachieving90%cleanenergy.Variouscomplementaryapproachescouldhelpachievethisdeepdecarbonization,withpotentialforevenlowersystemcostsandacceleratedemissionsreductions.Demand-sideapproachesincludedemandresponseandflexibleloads,suchasflexibleelectricvehiclechargingandflexiblewaterheating—whichcouldplayalargeroleifbuildingandvehicleelectrificationoccursmorerapidlythanenvisionedinourcorecases.Flexibleloadcouldsimilarlytakeadvantageofzeroornegativelypricedelectricitythatislikelytooccurduringthehoursofcurtailment,whichwilllikelyincreasetheoverallcleanenergyshare.Newsupply-sideresources,suchasfirmlow-carbongenerationorlonger-durationstorage,couldalsoprovidesystemflexibility.Firm,low-carbonresourcescouldincludeelectricitygenerationfromgases(suchashydrogenormethane)producedviaexcesscleanelectricity,smallmodularnuclearreactors,long-durationstorage,orotheremergingtechnologies.Suchalternativeapproachestobalancinggenerationanddemandcouldcostlessthanretainingsignificantnaturalgascapacitythatisrarelyused.3.3ELECTRICITYCOSTSFROMTHE90%CLEANGRIDARELOWERTHANTODAY’SCOSTSWholesaleelectricity(generationplusincrementaltransmission)costsarelowerin2035underthe90%Cleancasethantheyaretoday(Figure9).8Thebasewholesaleelectricitycostunderthe90%Cleancaseis4.6cents/kWh,about10%lowerthanthe5.1cents/kWhin2020.Wholesalecostsinthe90%Cleancasein2035are4.2–5.6cents/kWhacrossallcostsensitivities.Theonlysensitivitycaseinwhichthosecostsaremarginally(10%)higherthancostsin2020assumesbothhightechnologycostsandhighfinancingcosts(seeAppendix3fordetails).Lowerwholesalecostswouldtranslateintolowerretailelectricityprices,assumingelectricitydistributioncostsdonotchangesignificantlyinthe90%Cleancase.97ThefactthatPLEXOScurtailsmorecleanenergygenerationthanReEDSisprimarilyduetotwofactors:1)ReEDSdoesnothavethefullsetofrealsystemconstraints;and2)wearenotmodellingacleanenergyconstraintornegativebidpricesinPLEXOS.8Costsincluderecoveryofcapitalcostsfromnewandexistinggenerationcapacity,fixedoperationsandmaintenancecosts,fuelandvariableoperationsandmaintenancecosts,andnewtransmission(bulkandspurline)investments.Thecostfiguresreferencedthroughoutthisreportrefertothetotalwholesalegenerationcostsplusthecostofadditionaltransmissioninvestmentsbeyond2019.9Weassumedistributioncostsdonotrisefasterthaninflationinthenext15years.Becausethe90%Cleancasedoesnotrelyheavilyondistributedenergyresources,thisisareasonableassumption.DistributedPVservesasaninputtotheReEDSmodelbasedonNREL’sdistributedgenerationmodel.In2035,underthe90%Cleancase,thereareapproximately60GWofdistributedPV,representingapproximately2%oftotalenergygeneration.2035THEREPORT21Thesefindingsaresimilartothefindingsofpower-systemstudiesconductedinthepast1–2years,butthecleanpowersystemtargetdateformostofthosestudiesis15yearslaterthan2035(Jayadevetal.2020,Bogdanovetal.2019).Ourfindingscontrastsharplywiththefindingsofstudiescompletedmorethan5yearsago,whichshowfutureelectricitybillsrisingcomparedtotoday’sbills.Forexample,NREL’sRenewableElectricityFuturesStudy,publishedin2012,projectedretailelectricitypriceincreasesofabout40%–70%above2010prices,forasystemwith90%renewableelectricitypenetrationin2050(NREL2012).Renewableenergyandbatterycostshavedeclinedmuchfasterthantheseolderstudiesassumed,whichisthemainreasontheircostresultsdiffersomuchfromours.FIGURE9.WholesaleElectricityCosts(CostsofGenerationandIncrementalTransmission)with(left)andwithout(right)Environmental(AirPollutionandCarbonEmissions)Costs,forthe90%CleanandNoNewPolicyCasesIfenvironmentalcostsareincluded,wholesaleelectricitycostsareabout33%lowerin2035underthe90%Cleancasethantheyarein2020,andtheyare25%lowerin2035underthe90%Cleancasethantheyarein2035undertheNoNewPolicycase.Withoutconsideringenvironmentalcosts,wholesaleelectricitycostsare10%lowerin2035underthe90%Cleancasethantheyarein2020,buttheyare12%higherin2035underthe90%Cleancasethantheyarein2035undertheNoNewPolicycase.80706050403020100202O202520302035202O202520302035$/MWh(2018REAL)$/MWh(2018REAL)90%CLEANW/ENVCOSTNONEWPOLICYW/ENVCOST80706050403020100NONEWPOLICYW/OENVCOST90%CLEANW/OENVCOSTLowrenewableenergyandstoragecostsaretheprimaryreasonthatelectricitycostsdeclineunderthe90%Cleancase.Section2showsthedramaticnationalrenewableenergyandstoragecosttrends.Figure10illustratesthatthesecompetitivecostsbecomeavailablethroughoutthecountry,eveninregionspreviouslyconsideredresource-poorforrenewableenergygeneration.Ourestimatesalignwithsomeoftherecentrenewableenergybidsseeninrelativelyresource-poorregions.2035THEREPORT22FIGURE10.AverageSolar(top)andWind(bottom)LCOEbyRegioninthe90%CleanCasein2035Themapsshowcapacity-weightedaverageLCOEfortheleast-costportfoliotomeetthe90%cleanenergytargetforthe134balancingareasrepresentedinReEDS.LCOEincludesthecurrentphase-outofthefederalrenewableenergyinvestmentandproductiontaxcredits.TheLCOEinmostzonesislowerthan3.5cents/kWh.WeuseNREL’s2019ATBMid-Case(NREL2019)forcostprojectionswithsomemodifications,whichaccountforthecostreductionsalreadybenchmarkedtorecentPPApricing.WINDSOLAR2-3cents/kWh3-3.5cents/kWh3.5-4cents/kWh4-5cents/kWhNoCapacityAddedUnderthe90%Cleancase,mosttransmissioninvestmentsareinnewspurlinetransmissionratherthanbulktransmission(Figure11).10Althoughthe90%CleancaserequiresaboutthreetimesmorespurlineinvestmentthantheNoNewPolicycasedoes,thetotaltransmissionrequirementsinthe90%Cleancaseaddonly0.2cents/kWhtototalsystemcosts.11Recentstudiesthataccountforlowrenewableenergyandstoragecostshavesimilarfindings(Jayadevetal.2020).Studiesthatassumemuchhigherrenewableenergycostsordonotconsiderstoragefindhigherlevelsofadditionalbulktransmissionrequired(Clacketal.2017,NREL2012).12Furtherworkisneededtounderstandtransmissionneedsmoreprecisely.10Spurlinetransmissionreferstolinesneededtoconnectremoterenewableenergygenerationtothebulktransmissionsystemorloadcenters.Bulktransmissionreferstolarger,higher-capacitytransmissionlinesdesignedtocarryelectricityacrosslongdistancesathighvoltages,typicallyabove115kV.11Constructionofspurlinetransmissionislikelylesscomplexthanconstructionofbulktransmission,becausespurlinetransmissiontypicallydoesnotcrossmultiplejurisdictions.12WeassessedascenariowithhigherrenewableenergyandstoragecostsbasedonNRELATB2015(NREL2015)andfoundthatsignificantadditionalbulktransmissioniscost-effective,suggestingthat—whenrenewableenergyandbatterycostsarehigh—significantnewbulktransmissionisuseful.However,whenthosecostsarelow,asmodeledinthe90%Cleancase,limitednewbulktransmissioninvestmentsarenecessary.2035THEREPORT238070605040302010090%CLEAN90%CLEAN90%CLEANEASTERNINTERCONNECTWECCERCOTNONEWPOLICYNONEWPOLICYNONEWPOLICYNEWTRANSMISSIONINVESTMENT,2020-2035$BILLION(2018REAL)SpurlineBulkTransmission27219197111232Lowelectricitycostsinthe90%Cleancasearealsofacilitatedbythelimiteduseoffossilfuelgenerators;allcoalplantsareretiredby2035,andnonewnaturalgasplantsarebuilt(seeSection3.2).Thus,the90%Cleancaseavoidslargeamountsoffuelandlargeinvestmentsingeneratingcapacitythatisusedinfrequently.Inaddition,usinga2035targetyearprovidessufficienttimeforexistingfossilassetstorecovermostoftheirfixedcostsandthusavoidssignificantstranded-assetcosts.Oftheapproximately1,000GWofU.S.fossilfuelgenerationcapacityoperatingtoday,800GWwillbeatleast30yearsoldin2035(Figure12)(Jell2017).Atthistime,ahighpercentageofthecoalandoldernaturalgasunitswillbefullydepreciated(giventheusualdepreciationlifeof30yearsorless)andcanberetiredatlittleornocosttoconsumersandminimalstrandedcosts.13Forcoalplantswithsignificantundepreciatedbalances,securitizationofthesebalancesthroughgovernment-orratepayer-backedbondscanyieldsignificantsavingsandreducefinancialhardshipforassetowners,asdiscussedinanaccompanyingreportfromEnergyInnovation(EnergyInnovation2020).13Wedefinestrandedcostasthecostoffossilassetsthatarenotusedbuthavenotbeenfullydepreciated,assumingadepreciationlifeof30years.Fromamarketstandpoint,thisappliesonlytoassetsthatarebuiltandoperatedbyutilities.AssetsthatoperateunderaPPAoraremerchantpowerplantscannotbeconsideredstrandedfromamarketperspective.SeetheaccompanyingreportfromEnergyInnovationforfurtherdiscussionofstrandedassets(EnergyInnovation2020).FIGURE11.AdditionalSpurlineandBulkTransmissionInvestmentsbyInterconnectunderthe90%CleanandNoNewPolicyCases,2020–2035Thevastmajorityoftransmissioninvestmentsarespurlineinvestmentsasopposedtobulktransmissionsysteminvestments.Totaltransmissioninvestmentsaddonly0.2cents/kWhtosystemcostsinthe90%Cleancase.ERCOT=ElectricReliabilityCouncilofTexas,WECC=WesternElectricityCoordinatingCouncil.2035THEREPORT24Conversely,usingexistingnaturalgascapacitytomeetabout10%ofelectricitydemandavoidstheneedtobuildexcessrenewableenergyandlong-durationstoragecapacity—helpingacceleratethetimelinefor90%cleanelectricitywhilekeepingcostsdown.Furtherdecarbonizationcouldthenbuildonthismostlycleanelectricitysystem;severalpathwaysto100%cleanelectricityhavebeenidentified.SeeAppendix1forabriefliteraturereviewonmanyoftheseanalyses.Althoughelectricitycostsarelowerin2035underthe90%Cleancasethantheyaretoday,theyare0.46cents/kWh(12%)higherthantheyareundertheNoNewPolicycasein2035(Figure9).However,thiscomparisondoesnotaccountforthevalueofcarbonemissionsandairpollutantreductions,whichmakethesocietalcostsofelectricitysubstantiallylowerunderthe90%CleancasethantheyareundertheNoNewPolicycase(seeSection3.6).Inaddition,the90%CleancasesupportsadditionaljobsintheelectricitysectorcomparedwiththeNoNewPolicycase(Section3.5).Finally,significantnaturalgascapacityisbuiltundertheNoNewPolicycase,whichlikelywillresultinfuturestrandedcosts,whereasnonewfossilfuelcapacityisbuiltunderthe90%Cleancase.1414Iftherestillareafewcoalunitsownedbyregulatedutilitiesthat,in2035(orattimeofretirement)haveundepreciatedlife-extensionorpollution-controlcapitalcosts,thosecanberetiredatlowcostusingasecuritizationmechanism.Thisapproachhasbeenusedinrecentyearsbylargeinvestor-ownedandpublicutilitiestocreateapositivereturnforshareholdersanddownwardpressureonwholesaleandretailelectricityprices(LehrandO’Boyle2018).FIGURE12.UndepreciatedValueofExistingU.S.FossilFuelCapacity,2020–2035By2035,theremainingundepreciatedvalueoffossilfuelgeneratingplantsisminimal,suggestingatransitionto90%cleanenergycanbeaccomplishedwithminimalstrandedassets.0100200300400UNDEPRECIATEDVALUEOFEXISTINGFOSSILASSETS($BILLION)2020202520302035$BILLION(2018REAL)CoalGas-CombinedCycleGas-CombustionTurbineOther2035THEREPORT253.4SCALING-UPRENEWABLESTOACHIEVE90%CLEANENERGYBY2035ISFEASIBLEToachievethe90%Cleancaseby2035,1,100GWofnewwindandsolargenerationmustbebuilt,averagingabout70GWperyear(Figure13).Forcomparison,thesizeoftoday’sU.S.powersectorisapproximately1,000GW.Althoughchallenging,arenewableenergybuildoutofthismagnitudeisfeasiblewiththerightsupportingpoliciesinplace.Forexample,65GWofU.S.naturalgasgenerationwerebuiltin2002(Ray2017).1400120010008006004002000CUMULATIVENEWCAPACITYADDITIONSNEWCAPACITY(GW)BatteryStorageSolarWind202O202520302035HistoricalandplannedU.S.renewableenergydeploymentsalsosuggestthatannualdeploymentsof70GWarepossible.In2016,15GWofPVwereinstalled,andEIAsuggeststhat19.4GWofwindwillbedeployedin2020(EIA2020b).InterconnectionqueuesintheUnitedStatescurrentlyinclude544GWofwind,solar,andstandalonebatterystorage,roughlyhalfofthe1,100GWrequired(Bolingeretal.2019a,2019b).Storage,onshorewind,andsolargenerationgenerallyhaveshorterconstructiontimescomparedwithnaturalgasplants,andtheydonotrequireagaspipelineconnection.Significantpolicysupportisneededtoachievethislevelofrenewableenergydeployment,ashighlightedinanaccompanyingreportfromEnergyInnovation(2020).Newrenewableresourcescanbebuiltcost-effectivelyinallregionsofthecountry,asindicatedbytheproliferationofutility-scalerenewablesnationwide.Thetop10statesforinstalledutility-scalesolarrepresentatleastfourdistinctregions:NewEngland,theSoutheast,theWest,andtheSouthwest.MorethanFIGURE13.CumulativeNewCapacityAdditionsinthe90%CleanCase,2020–20352035THEREPORT2675%ofU.S.stateshaveoneormoreutility-scalesolarprojects(Bolingeretal.2019a,2019b).TheMidwest,onceconsideredalaggardforutility-scalerenewableprojects,accountedforthelargestpercentageofsolaraddedtointerconnectionqueuesin2018(26%).3.5THE90%CLEANGRIDCANSIGNIFICANTLYINCREASEENERGY-SECTOREMPLOYMENTTheCOVID-19pandemichastakenaheavyhumanandeconomictoll.Injust6weeks,thepandemicwipedoutover40millionAmericanjobs.Inaslacklabormarket,suchastheonethatAmericansmayexperienceinthecomingyearsowingtoacontractingeconomy,acleanenergybuildoutcouldbeakeypartoftheeconomicrecovery.The90%Cleancasesupportsapproximately29millionjob-yearscumulativelyduring2020–2035.Employmentrelatedtotheenergysectorincreasesbyabout8.5millionjob-yearsasincreasedemploymentfromexpandingrenewableenergyandbatterystoragemorethanreplaceslostemploymentrelatedtodecliningfossilfuelgeneration(Figure14).TheNoNewPolicycaserequiresone-thirdfewerjobs,foratotalof20millionjob-yearsoverthestudyperiod.Thesejobsincludedirect,indirect,andinducedjobsrelatedtoconstruction,manufacturing,operationsandmaintenance,andthesupplychain.15Inthe90%Cleancase,anincreaseinconstruction-andmanufacturing-relatedjobsoutweighsasmallerdecreaseinjobsrelatedtooperationsandmaintenance.Fossilfuelpower-sectorjobsaredominatedbyfuelhandling,operations,andmaintenanceactivity.Solar,wind,andstorageplantsrequirelessdailymaintenanceandnofuelhandling,buttheydorequirefarmorelabor-intensiveconstructionjobs.1615Ajob-yearrepresentsonefull-timejobheldforoneyear.16Thereisuncertaintyaboutwherecleanenergymanufacturingmightoccurina90%Cleancase.TheemploymentfactorsmodeledinIMPLANassumemostPV,wind,andbatterycomponentmanufacturingoccursintheUnitedStates.Thisassumptionpotentiallyoverstatestheresultingdomesticjobsinallscenarios;thoseresultsshouldbeconsideredasupperboundsofemploymentpotential.SupportingfederalpolicycandriveemploymentinthesesectorsandensurejobsinmanufacturingandthesupplychainremainintheUnitedStates,asindicatedinasupportingreportfromEnergyInnovation(2020).2035THEREPORT27-4,000-2,00002,0004,0006,0008,00010,00012,000CUMULATIVEJOB-YEARS(‘000),90%CLEANCOMPAREDTONONEWPOLICYNETTOTALINDUCEDINDIRECTDIRECTConstruction&ManufacturingOperations&MaintenanceFIGURE14.CumulativeJob-Years2020–2035,90%CleanCaseComparedtotheNoNewPolicyCaseOverall,the90%Cleancasesupportsover500,000morejobseachyearcomparedtotheNoNewPolicycase.Alossofabout100,000fossilfueloperationsandmaintenancejobsismorethanoffsetbygrowthinwindandsolarconstructionofover600,000jobsperyear.The90%Cleancasesupportsabout1.8millionongoingjobs,oratotalofapproximately29millionjob-yearsfrom2020–2035.About1.1millionjobs,or18millionjob-years,arerelatedtotheconstruction,manufacturing,andsupplychainoftheelectricitysystem(includinginducedjobs).Theadditional700,000jobs(11millionjob-years)arerelatedtooperationsandmaintenance.Incontrast,theNoNewPolicycasesupportsapproximately1.3millionongoingjobs,or20millionjob-yearsfrom2020–2035.Approximately460,000ongoingjobs(7.4millionjob-years)arerelatedtoconstruction,manufacturing,andsupplychainindustries,whileanother813,000(13millionjob-years)arerelatedtooperationsandmaintenance.AlthougheconomicmodelssuchasIMPLANareusefulindeterminingtheupsidepotentialofjobcreation,theresultsareonlyrealizedthroughsignificantpolicysupport.TheextraordinaryeconomicdownturnresultingfromtheCOVID-19pandemicpresentsanopportunitytodrivejobcreationintheneartermthroughacceleratedrenewableenergydeployment.The2009AmericanReinvestmentandRecoveryActcanserveasamodelforeffectivestimulusspending(MundacaandLuthRichter2015).Allregionsofthecountrycouldexperiencesignificanteconomicactivityfromlocalrenewableenergygenerationandstoragedeployment.However,insomecommunities,theshiftawayfromfossilfuelgenerationmaydisruptworkersandcommunitiesthatrelyonjobsandtaxrevenuerelatedtofossil2035THEREPORT28fuelproductionandpowergeneration.Policiesimplementedtodecarbonizethepowersectorshouldincludeexplicitmeasurestosupporttransitionstoalower-carboneconomy.ExistingresearchsuggeststhatwindandPVplantscanbebuiltclosetomanyretiringcoalplants,helpingtoprovideneweconomicopportunitiesintheimpactedcommunities(Gimonetal.2019).Supportforeconomicredevelopmentanddiversificationbeyondthecleanenergyindustrycanhelpmoregenerallywithaneffectivetransitionfromfossilfuels.AsupportingreportfromEnergyInnovationhighlightskeypolicydriverstosupportcoalcommunityservices,health,andemploymentduringtheenergytransition(EnergyInnovation2020).Appendix4reportstheemploymentresultsindetail.3.6THE90%CLEANGRIDAVOIDS$1.2TRILLIONINHEALTHANDENVIRONMENTALDAMAGES,INCLUDING85,000PREMATUREDEATHS,THROUGH2050The90%CleancasenearlyeliminatesemissionsfromtheU.S.powersectorby2035(Figure15),resultinginenvironmentalcostsavingsaswellasreducedmortalityrelatedtoelectricitygeneration.Further,achieving90%cleanelectricityby2035acceleratesbenefitsinensuingyears,becausetheNoNewPolicypowersystemcontinuestobefossilfueldependent.Weestimateclimate-relatedimpactsusingasocialcostofcarbonvalue,andweestimatehumanhealthdamagesduetoNOx,SO2,andfineparticulatematter(PM2.5)emissionsusinganestablishedmethodfromtheliterature.17ComparedtotheNoNewPolicycase,inthe90%CleancaseCO2emissionsarereducedby1,300millionmetrictons(88%)through2035,whileNOxandSO2emissionsarereducedby96%and99%,respectively(Figure15).SeeAppendix4fordetailsoftheanalysis.17Benefitsofreducedgreenhousegasemissionsarevaluedatasocialcostofcarbonofapproximately$50/metricton(derivedfromBakeretal.2019andRickeetal.2018).AvoidedairpollutiondamageestimatesforSO2,NOx,andPM2.5arebasedonstate-by-statedamagefactorsprovidedbyManinderThindbasedonThindetal.(2019).2035THEREPORT29FIGURE15.EmissionsofCO2,SO2,andNOxinthe90%CleanandNoNewPolicyCases,2020–203520001800160014001200100080060040020002020202520302035MILLIONTONS/YR90%CLEANNONEWPOLICYCO2EMISSIONS(MILLIONTONS/YR)1.21.00.80.60.40.20.0202020252030203590%CLEANNONEWPOLICYSO2EMISSIONS(MILLIONTONS/YR)MILLIONTONS/YR1.21.00.80.60.40.20.02020202520302035NONEWPOLICYNOXEMISSIONS(MILLIONTONS/YR)90%CLEANMILLIONTONS/YRAsaresult,the90%Cleancaseavoidsabout$1.2trillion(in2018dollars)inenvironmentalandhealthcoststhrough2050,includingapproximately85,000prematuredeaths,largelyduetoavoidedSO2,NOx,andCO2emissionsfromcoalplants(Figure16)(Hollandetal.2019).18Theenvironmentalcostsavingsfromthe90%Cleancaseroughlyequateto2cents/kWhofwholesaleelectricitycosts.AvoidedprematuredeathsareprimarilybecauseofreducedexposuretoPM2.5,drivenbyreductionsinSO2emissions,aprecursortoPM2.5,fromcoalplants.19About60%oftheavoidedenvironmentalcostsarefromavoidedCO2emissions,withtheremainderassociatedwithreducedexposuretoPM2.5.18Coalpowergenerationaccountedforabout90%ofairpollutionrelatedprematuredeathsandabout60%ofCO2emissionsassociatedwiththeU.S.powersectorin2019.Themarginalenvironmentaldamageofcoal(whichourmodelingdoesnotincludeinourmainscenarios)ishighlysignificant(abouttwotimesthevariablecostofcoal).Thisfact,andtheverylowcapacityfactorspredictedforcoalplantsin2035,ledustoassumethatallcoalpowerplantsretireafter40yearsoflife(whichallowsthemtorecovermostoftheirfixedcosts).In2035,wefindthatabout10%ofthecoalcapacitywillbe40yearsoldoryounger.19PrimaryPM2.5emissionsfactorsarenotmodeledinReEDS,andhenceourestimateofreducedemissionscontributingtoreducedPM2.5exposuremaybeconservative.BasedonThindetal.(2019)andGoodkindetal.(2019),primaryPM2.5emissionscontributetoroughly10%–15%ofprematuredeathsduetoPM2.5exposure.2035THEREPORT30120,000100,00080,00060,00040,00020,0000CUMULATIVEPREMATUREDEATHS90%CLEANNONEWPOLICYFIGURE16.CumulativePrematureDeathsDuetoSO2andNOxPollution,2020–2050CUMULATIVEPREMATUREDEATHS202O203020402050THE90%CLEANCASEAVOIDSABOUT85,000PREMATUREDEATHSBY2050RELATIVETOTHENONEWPOLICYCASE.Theseestimatesaremeanttoillustratethemagnitudeofsomeofthesocietalbenefitsthatmayberealizedthroughrapidpower-sectordecarbonization.However,theenvironmentalandhealthimpactsofelectricityusearesubjecttosubstantialuncertainties,anddifferencesininputparametersprovidedbyvarioussourcescanhavelargeeffectsonimpactcalculations(Thindetal.2019).Ourestimateofprematuredeaths(about3,500peryear)fortheNoNewPolicycaseisapproximatelyhalftheestimatereportedinmuchoftheexistingliterature,suggestingouranalysispresentsaconservativeestimateofprematuredeaths.20Ourassumptionsregardingthesocialcostofcarbonarebasedonthelowerrangeofestimatesofnationalsocialcostofcarboncalculations.Importantmilestonescanbeachievedbefore2035aswell.Thisreportshowsthat,by2030,theUnitedStatescanreachover70%zero-carbonelectricityonthegridatnoadditionalcost.TheIPCCstatesthatglobaleconomy-wideemissionsmustbereduced45%by2030from2010levelstolimitwarmingto1.5°(UNIPCC2018).Usinga2010baseline,reachingover70%zero-carbonelectricityintheUnitedStatesby2030wouldcontributean18%reductioninU.S.economy-wideemissions,andreaching90%zero-carbonelectricitywouldcontributea27%reductionby2035.Thisisameaningfulcontributiontotheoverall20EstimatesofprematuredeathscitedinThindetal.(2019)rangebetween10,000and17,050prematuredeathsperyear.2035THEREPORT31requirementsoutlinedbytheIPCC,andacleanelectricitysystemcanhelpreduceemissionsfromtransportationandbuildingsviaconversiontoelectricvehiclesandappliances.Refiningtheestimatesofbenefitsfromthe90%Cleancaseisanimportantareaforfuturework.Appendix4providesanalysisoftwoparticularimpactsofexpandingrenewableenergytechnologiesandshrinkingfossilfuelgeneration:reducedwateruseandincreasedlanduserelatedtoelectricitygeneration.SOCIALCOSTOFCARBONCASEWeanalyzeascenarioinwhichthesocialcostsofCO2emissionsareembeddedintothewholesalegenerationcostoffossilfuelplants.TheCO2pricebeginsat$10/metrictonin2020,rampsupby5%until2025,andthenincreases1.5%eachyearthereafter,reaching$50/metrictonin2035.Thiscaserapidlyacceleratestheearlyretirementofcoalpoweranddramaticallyscalesupearlyinvestmentsinnewrenewableenergyresources.AlthoughthiscaseisslightlymoreexpensivethantheNoNewPolicycase,thereductionsinCO2emissions,airpollutants,andassociatedenvironmentalcostsareextraordinarilylarge.SeeAppendix2and3fordetails.ACHIEVINGA100%-CLEANU.S.POWERSECTORThisreport’stargetof90%cleanelectricity(ratherthan100%)by2035isimportantforenvisioningdecarbonizationatapacemorerapidthanconsideredinconventionalpolicymakingandacademicresearch.Theuseofcurrentlyavailable,cost-effectivetechnologytoacceleratenear-completepower-sectordecarbonizationprovidesadditionaltimeandresourcestopursuecompletepower-sectordecarbonization.Significantuncertaintiessurroundtheeconomicandoperationalviabilityofpotentialtechnologiesandstrategiesneededtoachieve100%power-sectordecarbonization,andtheseapproachesaresubjecttoconsiderabledebate.Researchanddevelopmentneedsandpoliciestoscaleupthetechnologiesneededfor100%cleanelectricityaredetailedinEnergyInnovation’scompanionpolicyreport(2020).Themajorcontributionofourreportisitsdemonstrationofapathtonear-completepower-sectordecarbonizationthatisreadilyavailableandcost-effective—onlyconcertedpolicyactionisrequiredtoramp-upaffordablecleangenerationandstoptheconstructionofunnecessaryfossilfuelplants.Achievingthisnear-completepower-sectordecarbonizationin2035mayultimatelyincreasethespeedandcost-effectivenessofpervasive,cross-sectordecarbonization.2035THEREPORT32AlthoughweassessoperationalfeasibilityoftheU.S.powersystemusingweather-synchronizedloadandgenerationdata,furtherworkisneededtoadvanceourunderstandingofotherfacetsofa90%cleanpowersystem.First,thisreportprimarilyfocusesonrenewable-specifictechnologypathwaysanddoesnotexplorethefullportfolioofcleantechnologiesthatcouldcontributetofutureelectricitysupply.Importantly,ourmodelingapproachrepresentsaconservativestrategytoachieve90%cleanenergy.Anumberofcomplementarytechnologiesorapproachescouldcontributetodeepdecarbonization,manyofwhichcouldresultinevenlowersystemcostsoracceleratedemissionsreductions.Additionally,issuessuchaslossofloadprobability,systeminertia,andalternating-currenttransmissionflowsneedfurtherassessment.Optionstoaddresstheseissueshavebeenidentifiedelsewhere(e.g.Denholm2020).Althoughthisanalysisdoesnotattemptafullpower-systemreliabilityassessment,weperformscenarioandsensitivityanalysistoensurethatdemandismetinallperiods,includingduringextremeweathereventsandperiodsoflowrenewableenergygeneration.Thismodelingapproachprovidesconfidencethata90%cleanelectricitygridisoperational.Finally,althoughthisreportdescribesthesystemcharacteristicsneededtoaccommodatehighlevelsofrenewablegeneration,itdoesnotaddresstheinstitutional,market,andregulatorychangesthatareneededtofacilitatesuchatransformation.AsupportingreportfromEnergyInnovationidentifiesmanyofthesesolutions(EnergyInnovation2020).Furtherstudylimitationsandamorerobustnarrativeofdetailedresultscanbefoundintheappendices.The2035Reportdetailshowrenewableenergyandbatterystoragecostshavefallentosuchanextentthat,withconcertedpolicyefforts,theU.S.powersectorcanreach90%cleanenergyby2035withoutincreasingconsumerbillsorimpactingtheoperabilityoftheelectricgrid.Indoingso,theU.S.powersectorcaninjectover$1.7trillionincleanenergyinvestmentsintotheU.S.economy,supportemploymentequivalenttoabout29millionjob-yearscumulativelyduring2020–2035,andlargelyeliminateplanet-warmingandairpollutionemissionsfrom4CAVEATSANDFUTUREWORK2035THEREPORT33electricitygeneration.This90%cleanelectricitygridcanprovideclean,dependablepowerwithouttheconstructionofnewfossilfuelplants.However,the90%cleangridcannotbeachievedwithoutconcertedpolicyaction,andbusiness-as-usualcouldleadtoover$1.2trillionincumulativehealthandenvironmentaldamages,including85,000prematuredeaths.Perhapsmostimportantly,thisreportshowsthatthetimelinefornear-completedecarbonizationoftheelectricsectorcanbeacceleratedfrom2050to2035.Thisiscritical,becausepower-sectordecarbonizationcanbethecatalystfordecarbonizationacrossalleconomicsectorsviaelectrificationofvehicles,buildings,andindustry.Owingtotheglobalnatureofrenewableenergyandbatterymarkets,ourreportindicatesthepossibilitythatcost-effectivedecarbonizationcanbeanear-termrealityforotherregionsandcountries.Moreresearchisneededtoidentifythepotentialfornear-completedecarbonizationinthe2035timeframeinotherregionsoftheworld.Suchrapiddecarbonization,ifpursuedbyotherhigh-emittingjurisdictionsworldwide,wouldincreasethelikelihoodoflimitingglobalwarmingto1.5°C.Thisreport’stargetof90%cleanelectricity(ratherthan100%)by2035isalsoimportantforenvisioningdecarbonizationatapacemorerapidthanconsideredinpreviousstudies.Thistargetallowssomeexistingnaturalgasgenerationcapacitytobeusedinfrequentlytomeetdemandduringperiodsoflowrenewableenergygeneration,whichotherwiserequiremajoradditionalinvestmentsinrenewableenergyandenergystorage,increasingcostsdramatically.2035THEREPORT34Aggarwal,SoniaandMikeO’Boyle.2020.TopPoliciestoCapturetheEconomicOpportunityofaCleanElectricitySystem.EnergyInnovation.Baker,J.A,H.M.Paulson,M.Feldstein,G.P.Shultz,T.Halstead,T.Stephenson,N.G.Mankiw,andR.Walton.2019.TheClimateLeadershipCouncilCarbonDividendsPlan.ClimateLeadershipCouncil.Bogdanov,D.,J.Farfan,K.Sadovskaia,A.Aghahosseini,M.Child,A.Gulagi,A.SolomonOyewo,L.deSouzaNoelSimasBarbosa,andC.Breyer.2019.RadicalTransformationPathwayTowardsSustainableElectricityViaEvolutionarySteps.NatureCommunications10(1077).Bolinger,M.,J.Seel,andD.Robson.2019a.Utility-ScaleSolar:EmpiricalTrendsinProjectTechnology,Cost,Performance,andPPAPricingintheUnitedStates–2019Edition.LawrenceBerkeleyNationalLaboratory.Bolinger,M.,J.Seel,andD.Robson.2019b.Utility-ScaleSolar:EmpiricalTrendsinProjectTechnology,Cost,Performance,andPPAPricingintheUnitedStates–2019Edition.Presentation.LawrenceBerkeleyNationalLaboratory.Clack,C.T.M.,S.A.Qvist,J.Apt,M.Bazilian,A.R.Brandt,K.Caldeira,S.J.Davis,V.Diakov,M.A.Handschy,P.D.H.Hines,P.Jaramillo,D.M.Kammen,J.C.S.Long,M.GrangerMorgan,A.Reed,V.Sivaram,J.Sweeney,G.R.Tynan,D.G.Victor,J.P.Weyant,andJ.F.Whitacre.2017.EvaluationofaProposalforReliableLow-CostGridPowerwith100%Wind,Water,andSolar.PNAS114(26):6722–6727.Denholm,Paul,TrieuMai,RickWallaceKenyon,BenKroposki,andMarkO’Malley.2020.InertiaandthePowerGrid:AGuideWithouttheSpin.Golden,CO:NationalRenewableEnergyLaboratory.NREL/TP-6120-73856.EIA(U.S.EnergyInformationAdministration).2020a.AnnualEnergyOutlook2020.EIA.EIA(U.S.EnergyInformationAdministration).2020b.Short-TermEnergyOutlook.AccessedApril2020.Fu,R.,T.Remo,R.Margolis.2018a.2018USUtility-ScalePhotovoltaics-Plus-EnergyStorageSystemCostsBenchmark.NationalRenewableEnergyLaboratory.Gimon,E.,M.O’Boyle,C.T.M.Clack,andS.McKee.2019.CoalCostCrossover:EconomicViabilityofExistingCoalComparedtoNewLocalWindandSolarResources.VibrantCleanEnergyandEnergyInnovation.Goldie-Scot,L.2019.ABehindtheScenesTakeonLithium-ionBatteryPrices.BloombergNewEnergyFinance.REFERENCES2035THEREPORT35Goodkind,A.L.,C.W.Tessum,J.S.Coggins,J.D.Hill,andJ.D.Marshall.2019.Fine-ScaleDamageEstimatesofParticulateMatterAirPollutionRevealOpportunitiesforLocation-SpecificMitigationofEmissions.PNAS116(18):8775–8780.Holland,S.P.,E.T.Mansur,N.Z.Muller,andA.J.Yates.2019.DecompositionsandPolicyConsequencesofanExtraordinaryDeclineinAirPollutionfromElectricityGeneration.DartmouthCollege.Jayadev,G.,B.D.Leibowicz,andE.Kutanoglu.2020.U.S.ElectricityInfrastructureoftheFuture:GenerationandTransmissionPathwaysThrough2050.AppliedEnergy260:114267.Jell,S.2017.MostCoalPlantsintheUnitedStatesWereBuiltBefore1990.U.S.EnergyInformationAdministration.Joskow,P.L.2004.TransmissionPolicyintheUnitedStates.MITCenterforEnergyandEnvironmentalPolicyResearch.Lehr,R.,M.O’Boyle.2018.DepreciationandEarlyRetirements.EnergyInnovation.MacDonald,A.E.,C.T.M.Clack,A.Alexander,A.Dunbar,J.Wilczak,andY.Xie.2016.FutureCost-CompetitiveElectricitySystemsandTheirImpactonUSCO2Emissions.NatureClimateChange6:526–531.Mai,Trieu,PaigeJadun,JeffreyLogan,ColinMcMillan,MatteoMuratori,DanielSteinberg,LauraVimmerstedt,RyanJones,BenjaminHaley,andBrentNelson.2018.ElectrificationFuturesStudy:ScenariosofElectricTechnologyAdoptionandPowerConsumptionfortheUnitedStates.Golden,CO:NationalRenewableEnergyLaboratory.NREL/TP-6A20-71500.Mundaca,L.,andJ.LuthRichter.2015.Assessing‘GreenEnergyEconomy’StimulusPackages:EvidencefromtheU.S.ProgramsTargetingRenewableEnergy.RenewableandSustainableEnergyReviews42:1174–1186.NREL(NationalRenewableEnergyLaboratory).2012.RenewableElectricityFuturesStudy.NREL.NREL(NationalRenewableEnergyLaboratory).2019.AnnualTechnologyBaseline:Electricity2019.NREL.NREL(NationalRenewableEnergyLaboratory).2018b.AnnualTechnologyBaseline:Electricity2018.NREL.NREL(NationalRenewableEnergyLaboratory).2017.AnnualTechnologyBaseline:Electricity2017.NREL.NREL(NationalRenewableEnergyLaboratory).2016.AnnualTechnologyBaseline:Electricity2016.NREL.NREL(NationalRenewableEnergyLaboratory).2015.AnnualTechnologyBaseline:Electricity2015.NREL.Ray,S.2017.USElectricGeneratingCapacityIncreasein2016WasLargestNetChangeSince2011.U.S.EnergyInformationAdministration.Ricke,K.,L.Drouet,K.Caldeira,andM.Tavoni.2018.Country-LevelSocialCostofCarbon.NatureClimateChange8:895–900.2035THEREPORT36Shaner,M.R.,S.J.Davis,N.S.Lewis,andK.Caldeira.2018.GeophysicalConstraintsontheReliabilityofSolarandWindPowerintheUnitedStates.Energy&EnvironmentalScience11:914–925.Thind,M.P.S.,C.W.Tessum,I.L.Azevedo,andJ.D.Marshall.2019.FineParticulateAirPollutionfromElectricityGenerationintheUS:HealthImpactsbyRace,Income,andGeography.EnvironmentalScience&Technology53(23):14010–14019.UNIPCC(UnitedNationsIntergovernmentalPanelonClimateChange).2018.SpecialReport:GlobalWarmingof1.5°.UNIPCC.Wiser,R.,M.Bolinger.2019.2018WindTechnologiesMarketReport.LawrenceBerkeleyNationalLaboratory.2035THEREPORT37

1、当您付费下载文档后,您只拥有了使用权限,并不意味着购买了版权,文档只能用于自身使用,不得用于其他商业用途(如 [转卖]进行直接盈利或[编辑后售卖]进行间接盈利)。
2、本站所有内容均由合作方或网友上传,本站不对文档的完整性、权威性及其观点立场正确性做任何保证或承诺!文档内容仅供研究参考,付费前请自行鉴别。
3、如文档内容存在违规,或者侵犯商业秘密、侵犯著作权等,请点击“违规举报”。

碎片内容

碳中和
已认证
内容提供者

碳中和

确认删除?
回到顶部