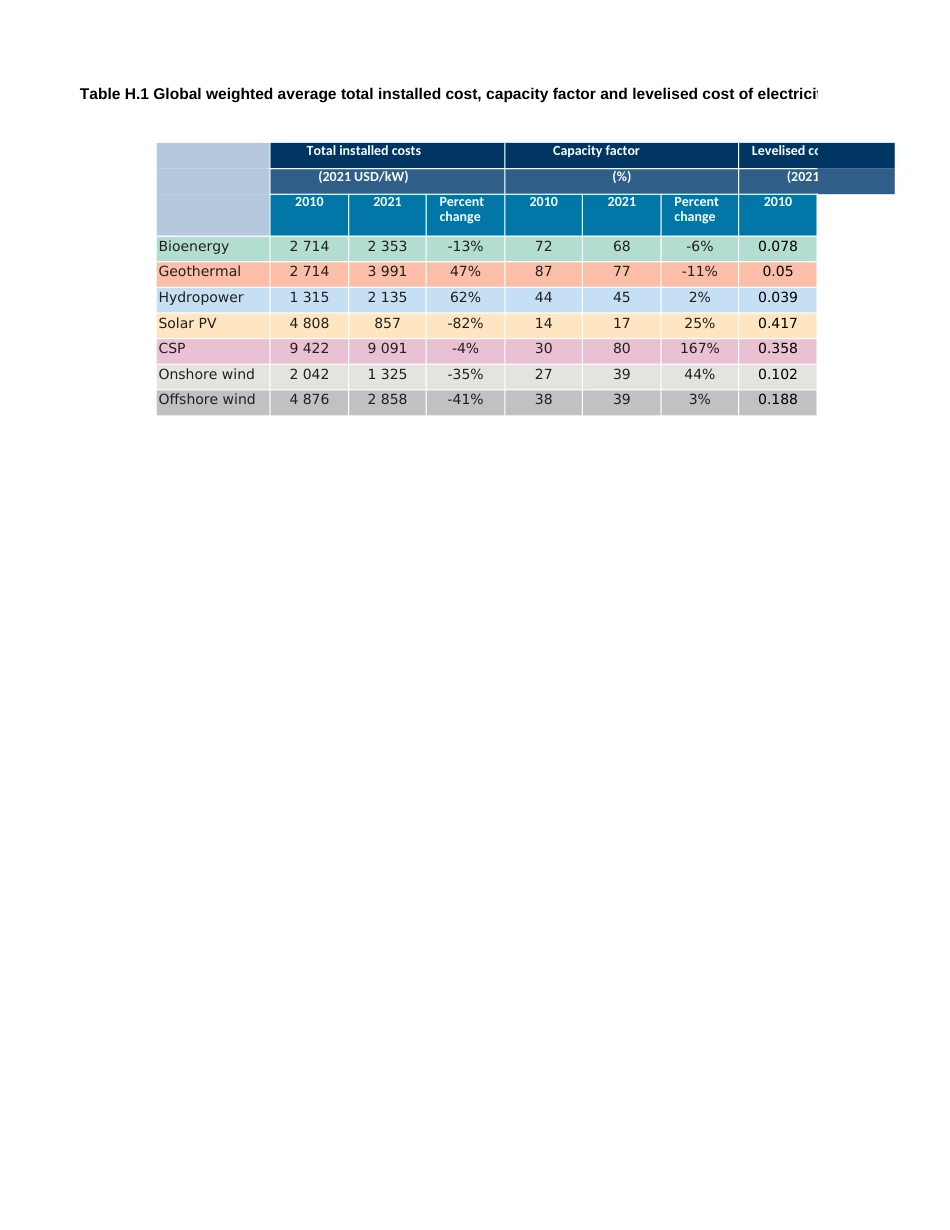
Renewable Power Generation Costs in 2021This publication should be cited as: Citation: IRENA (2022), Renewable Power Generation Costs inContentsHighlightsExecutive SummaryThis file contains data from the above mentioned report. Note: Monetary values in this report are expressed in real 2021 USD (that is to say, takinContact:1. Latest cost trends2. Onshore wind3. Solar PV4. Offshore wind5. Concentrating solar power6. Hydropower7. Geothermal8. BioenergyAnnex IOperations & Maintenacecosts@irena.orgts in 2021newable Power Generation Costs in 2021, International Renewable Energy Agency, Abu Dhabi.al 2021 USD (that is to say, taking into account inflation) unless explicitly mentioned.20102021201020212010-13%7268-6%0.07847%8777-11%0.0562%44452%0.039857-82%141725%0.417-4%3080167%0.358-35%273944%0.102-41%38393%0.188Table H.1 Global weighted average total installed cost, capacity factor and levelised cost of electricity trends bytechnology, 2010 and 2021Total installed costsCapacity factorLevelised cost of electricity(2021 USD/kW)(%)(2021 USD/kWh)Percent changePercent changeBioenergy2 7142 353Geothermal2 7143 991Hydropower1 3152 135Solar PV4 808CSP9 4229 091Onshore wind2 0421 325Offshore wind4 8762 85820210.067-14%0.06834%0.04824%0.048-88%0.114-68%0.033-68%0.075-60%of electricity trends byLevelised cost of electricity(2021 USD/kWh)Percent changeFigure S.1 Change in global weighted levelised cost of electricity by technology, 2020-2021Solar photovoltaicYear-on-year percentage reduction 2020-2021-13%gy, 2020-2021Ofshore windOnshore windConcentrating solar power-13%-15%7%Total installed cost (2021 USD/kW)2010201120122013Solar photovoltaic4 8084 1043 1242 742Offshore wind4 8765 5844 9425 223Onshore wind2 0442 0001 9061 965Capacity factor (%)2010201120122013Solar photovoltaic13.80%15.30%15.10%16.4...