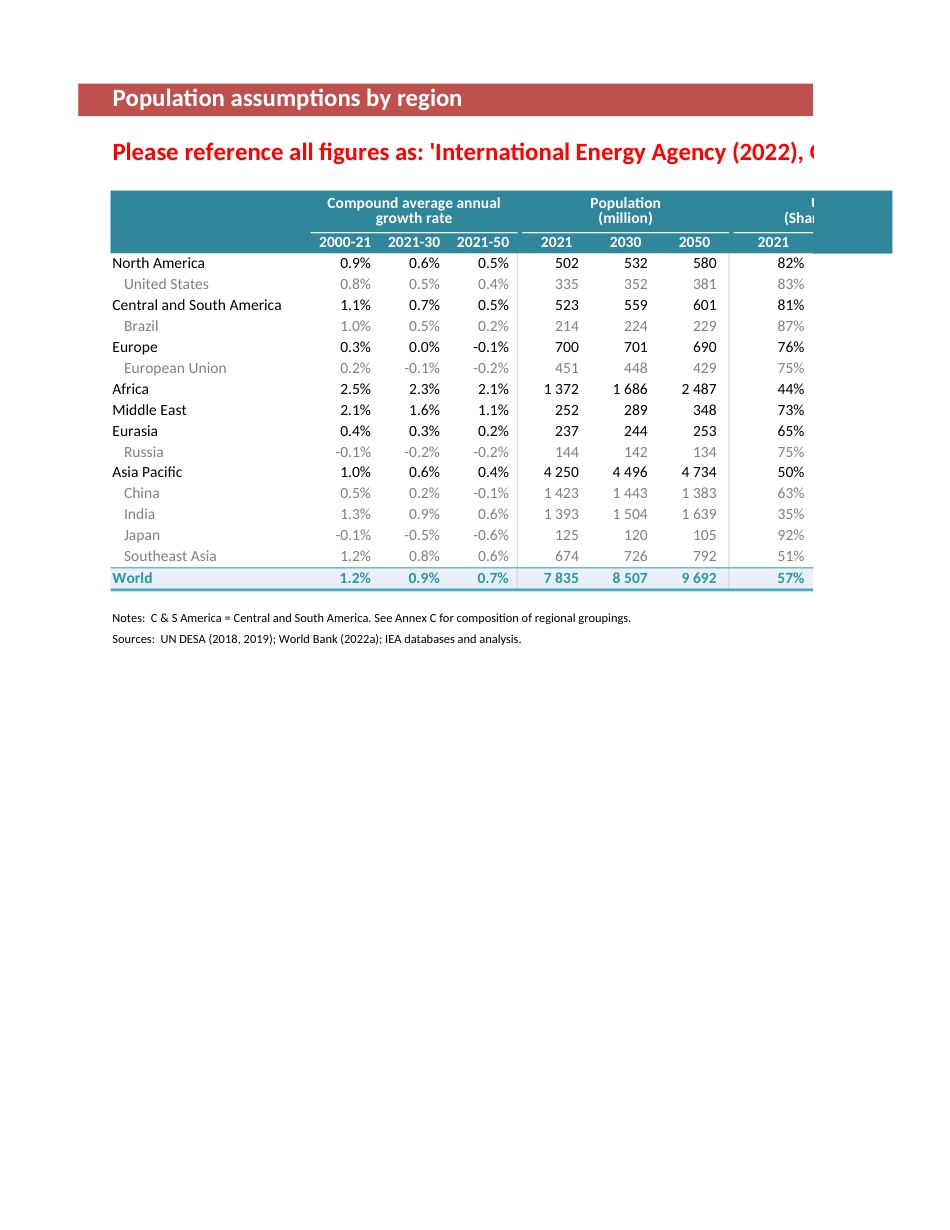
Please note that your use of this data is subject to our Terms and conditions (https://www.ieaIn particular, you would need to enter into a separate Licence Agreement with the IEA and payincluding scenario data, in any type of modelling for the purpose of creating derived data or dedisplay such derived products.For example, you require a separate Licence Agreement to create metrics, alignment pathwayscores at sector and/or company level in order to calculate and/or assess the climate complianIf you intend to have such usage, please contact compliance@iea.org.ns (https://www.iea.org/terms)with the IEA and pay an additional fee if you wish to use the IEA’s data, ng derived data or derived products, and any services to distribute or alignment pathways, decarbonisation pathways and/or temperature he climate compliance of investment portfolios and investment assets.Population assumptions by regionPlease reference all figures as: 'International Energy Agency (2022), Global Energy2000-212021-302021-502021203020502021North America0.9% 0.6% 0.5% 502 532 580 82% United States0.8% 0.5% 0.4% 335 352 381 83% Central and South America1.1% 0.7% 0.5% 523 559 601 81% Brazil1.0% 0.5% 0.2% 214 224 229 87% Europe0.3% 0.0% -0.1% 700 701 690 76% European Union0.2% -0.1% -0.2% 451 448 429 75% Africa2.5% 2.3% 2.1% 1 372 1 686 2 487 44% Middle East2.1% 1.6% 1.1% 252 289 348 73% Eurasia0.4% 0.3% 0.2% 237 244 253 65% Russia-0.1% -0.2% -0.2% 144 142 134 75% Asia Pacific1.0% 0.6% 0.4% 4 250 4 496 4 734 50% China0.5% 0.2% -0.1% 1 423 1 443 1 383 63% India1.3% 0.9% 0.6% 1 393 1 504 1 639 35% Japan-0.1% -0.5% -0.6% 125 120 105 92% Southeast Asia1.2% 0.8% 0.6% 674 726 792 51% World1.2% 0.9% 0.7% 7 835 8 507 9 692 57% Notes...